Property data
Sale history
Date Paid price Annual growth After inflation
Jul 2011 £166,000 4.1% 1.4%
Jul 2004 £125,500 19.5% 18.0%
May 1999 £49,950 na na
Floor plan

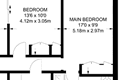
Archived estate agent floor plan for 12, Yarrow Close.

Floorplan 12
View floorplan
Internal area
106 square metres (1,141 square feet) according to latest EPC inspection
Price per internal area

This property sold for £1,566 per square metre (£145 per square foot) in Jul 2011. Indexed forward to today's value, this is roughly £2,567 per square metre (£238 per square foot) .

Date Paid price Paid £/sqm Today's value Today's value £/sqm
Jul 2011 £166,000 £1,566 £272,102 £2,567
Jul 2004 £125,500 £1,184 £219,694 £2,073
May 1999 £49,950 £471 £206,354 £1,947

Calculated using the latest EPC internal area of 106 m². Earlier sale dates may not have had the same measured area available.

Valuation
The most recent sale price indexed forward to today's value is £272,102. This is one data point to inform the valuation. Another method is the valuation implied by what comparable homes are selling for. Homes in Broughton are now selling for between £2,440 and £3,110 per square metre (£226 and £288 per square foot). Based on an internal area of 106 m², this implies a valuation between £259,000 and £330,000. Treat this as context only. For a valuation using hand-picked comparable sales, use the Advanced search tool — create a shortlist of similar condition homes, then export a valuation report.
Bedrooms
3
Type
Semi-detached
Council tax band
D
Plot size
315 square metres (3,391 square feet) - map showing freehold boundary lines
Archived listings
History:
Archived sales listing for 12 Yarrow Close. Advertised on multiple portals. It was reduced on 12/09/2015. It last appeared Oct 2015.
Photos:

There are 18 archived estate agent listing photos for 12 Yarrow Close.

Photos for 12 Yarrow Close
View photos
Advertiser remarks:
  • 3 bedrooms
EPC Inspections
Summary:
03 April 2012 - energy performance certificate grade C
Certificate:
View energy certificate on GOV.UK
Reason for EPC:
not sale or rental
Tenure:
Unknown
Property type:
Semi-Detached House , has 5 habitable rooms. Estimated year built 1976 to 1982
Area:
126 sqm (1,356 square foot) total internal area
Comments:
Walls: Cavity wall, as built, partial insulation (assumed). Roof: Pitched, 200 mm loft insulation. Heating: Boiler and radiators, mains gas.

Summary:
08 March 2011 - energy performance certificate grade C
Reason for EPC:
None
Tenure:
Owner-occupied
Property type:
None , has 5 habitable rooms. Estimated year built 1976 to 1982
Area:
106 sqm (1,141 square foot) total internal area
Comments:
Frequently asked questions

12 Yarrow Close is worth whatever price a willing buyer and seller agree upon. However, the following can provide useful context.

  • HouseMetric estimates the most recent sale price indexed forward to today's value is £272,102.
  • Based on an internal area of 106 m² and recent prices in Broughton, this implies a lower and upper quartile range from £259,000 to £330,000, using HouseMetric's implied valuation methodology.

According to HM Land Registry price paid data, 12 Yarrow Close last sold for £166,000 in July 2011.

HouseMetric shows 12 Yarrow Close as 106 m² (1,141 sq ft), based on the latest internal area data available for this property. The bedroom count is shown as 3 bedrooms. Bedroom numbers can come from a previous estate agency listing, an EPC record, or an estimate based on the size of the property.

The latest EPC rating shown by HouseMetric is C, from an inspection dated 03 April 2012. EPC information comes from the public Energy Performance Certificate data for England and Wales.

When we last checked, 12 Yarrow Close was in council tax band D. Council Tax bands can change, so check the latest Valuation Office Agency Council Tax list.

12 Yarrow Close is in postcode CH4 0QL, in Broughton. You can also view HouseMetric's sold-price page for Yarrow Close, CH4 0QL or analysis of the Broughton property market.

HouseMetric combines HM Land Registry price paid data, Energy Performance Certificate data and Ordnance Survey/open data. The data were last updated 4 August 2026. Figures such as indexed values and local valuation ranges are calculated estimates for context, while official records can change as public datasets are updated.

For more detail on HouseMetric data sources, update frequency and valuation methods, see the HouseMetric FAQs.