65, Sycamore Street, M33 2HD
65 Sycamore Street is a semi-detached home in Sale. It sold for £196,250 in October 2012. The Land Registry and EPC data was last updated 4 August 2026.
Property data
- Sale history
-
Date Paid price Annual growth After inflation Oct 2012 £196,250 5.8% 2.4% Jul 2010 £173,000 8.8% 6.6% Feb 1999 £66,500 na na - Floor plan
-
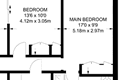
Archived estate agent floor plan for 65, Sycamore Street.
- Bedrooms
- 3
- Type
- Semi-detached
- Council tax band
- C
Archived listings

Planning applications
- Planning ref:
- March 2011 76277/HHA/2011
- Type:
- Full and householder planning application
- Status:
- Application approved with conditions
- Address:
- 65 Sycamore Street, Sale
- Description:
- Erection of a two storey side extension.
EPC Inspections
- Summary:
- 24 February 2010 - energy performance certificate grade D
- Reason for EPC:
- None
- Tenure:
- Owner-occupied
- Property type:
- None , has 4 habitable rooms. Estimated year built 1967 to 1975
- Area:
- 43 sqm (463 square foot) total internal area
- Comments:
Frequently asked questions
According to HM Land Registry price paid data, 65 Sycamore Street last sold for
£196,250 in
October 2012.
The bedroom count is shown as 3 bedrooms. Bedroom numbers can come from a previous estate agency listing, an EPC record, or an estimate based on the size of the property.
The latest EPC rating shown by HouseMetric is D, from an inspection dated 24 February 2010.
EPC information comes from the public Energy Performance Certificate data for England and Wales.
When we last checked, 65 Sycamore Street was in council tax band C.
Council Tax bands can change, so check the latest
Valuation Office Agency Council Tax list.
65 Sycamore Street is in postcode M33 2HD, in Sale.
You can also view HouseMetric's sold-price page for
Sycamore Street, M33 2HD
or
analysis of the Sale property market.
HouseMetric combines HM Land Registry price paid data, Energy Performance Certificate data and Ordnance Survey/open data.
The data were last updated 4 August 2026. Figures such as indexed values and local valuation ranges are calculated estimates for context, while official records can change as public datasets are updated.
For more detail on HouseMetric data sources, update frequency and valuation methods, see the HouseMetric FAQs.