South View, Hill Bottom, RG8 7PT
South View Hill Bottom is a 169 m² / 1,819 sq ft detached home in Pangbourne. It sold for £825,000 in September 2017. Indexed forward to today's value, that sale is roughly £941k. Recent local prices imply a broad valuation context of £754k to £1,022k based on its internal area. The Land Registry and EPC data was last updated 4 August 2026.
- Sale history
-
Date Paid price Annual growth After inflation Sep 2017 £825,000 4.2% 2.1% Sep 2002 £443,000 83.5% 79.8% Jan 2001 £162,500 242.0% 247.7% Oct 2000 £120,000 na na - Floor plan
-
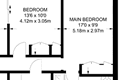
Archived estate agent floor plan for South View, Hill Bottom.
- Internal area
- 169 square metres (1,819 square feet) according to latest EPC inspection
- Price per internal area
-
This property sold for £4,881 per square metre (£453 per square foot) in Sep 2017. Indexed forward to today's value, this is roughly £5,570 per square metre (£517 per square foot) .
Date Paid price Paid £/sqm Today's value Today's value £/sqm Sep 2017 £825,000 £4,882 £941,366 £5,570 Sep 2002 £443,000 £2,621 £1,014,215 £6,001 Jan 2001 £162,500 £962 £452,043 £2,675 Oct 2000 £120,000 £710 £339,340 £2,008 Calculated using the latest EPC internal area of 169 m². Earlier sale dates may not have had the same measured area available.
- Valuation
- The most recent sale price indexed forward to today's value is £941,366. This is one data point to inform the valuation. Another method is the valuation implied by what comparable homes are selling for. Homes in Pangbourne are now selling for between £4,460 and £6,050 per square metre (£414 and £562 per square foot). Based on an internal area of 169 m², this implies a valuation between £754,000 and £1,022,000. Treat this as context only. For a valuation using hand-picked comparable sales, use the Advanced search tool — create a shortlist of similar condition homes, then export a valuation report.
- Bedrooms
- 3
- Type
- Detached
- Council tax band
- F
- Plot size
- 669 square metres (7,201 square feet) - map showing freehold boundary lines

- Summary:
- 08 May 2017 - energy performance certificate grade C
- Certificate:
- View energy certificate on GOV.UK
- Reason for EPC:
- Marketed sale
- Tenure:
- Owner-occupied
- Property type:
- Detached House , has 6 habitable rooms. Estimated year built 2003 to 2006
- Area:
- 169 sqm (1,819 square foot) total internal area
- Comments:
- Walls: Cavity wall, as built, insulated (assumed). Roof: Roof room(s), insulated (assumed). Heating: Boiler and radiators, mains gas.
South View Hill Bottom is worth whatever price a willing buyer and seller agree upon. However, the following can provide useful context.
- HouseMetric estimates the most recent sale price indexed forward to today's value is £941,366.
- Based on an internal area of 169 m² and recent prices in Pangbourne, this implies a lower and upper quartile range from £754,000 to £1,022,000, using HouseMetric's implied valuation methodology.
For more detail on HouseMetric data sources, update frequency and valuation methods, see the HouseMetric FAQs.