22, Shingle Bank Drive, SO41 0WQ
22 Shingle Bank Drive is a 126 m² / 1,356 sq ft semi-detached home in Milford On Sea. It sold for £710,000 in February 2021. Indexed forward to today's value, that sale is roughly £701k. Recent local prices imply a broad valuation context of £549k to £719k based on its internal area. The Land Registry and EPC data was last updated 22 September 2026.
- Sale history
-
Date Paid price Annual growth After inflation Feb 2021 £710,000 5.4% 3.3% Mar 2001 £250,000 na na - Floor plan
-
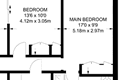
Archived estate agent floor plan for 22, Shingle Bank Drive.
- Internal area
- 126 square metres (1,356 square feet) according to latest EPC inspection
- Price per internal area
-
This property sold for £5,634 per square metre (£523 per square foot) in Feb 2021. Indexed forward to today's value, this is roughly £5,564 per square metre (£517 per square foot) .
Date Paid price Paid £/sqm Today's value Today's value £/sqm Feb 2021 £710,000 £5,635 £701,023 £5,564 Mar 2001 £250,000 £1,984 £718,720 £5,704 Calculated using the latest EPC internal area of 126 m². Earlier sale dates may not have had the same measured area available.
- Valuation
- The most recent sale price indexed forward to today's value is £701,023. This is one data point to inform the valuation. Another method is the valuation implied by what comparable homes are selling for. Homes in Milford On Sea are now selling for between £4,360 and £5,710 per square metre (£405 and £530 per square foot). Based on an internal area of 126 m², this implies a valuation between £549,000 and £719,000. Treat this as context only. For a valuation using hand-picked comparable sales, use the Advanced search tool — create a shortlist of similar condition homes, then export a valuation report.
- Bedrooms
- 4
- Type
- Semi-detached
- Council tax band
- E

- Planning ref:
- September 2021 21/10650
- Type:
- Full and householder planning application
- Status:
- Application approved with conditions
- Address:
- 22 SHINGLE BANK DRIVE, MILFORD-ON-SEA
- Description:
- Replacement balustrade to rear external balcony and steps; replace small section of rendered balcony wall with clear glazing (retrospective)
- Summary:
- 24 August 2020 - energy performance certificate grade D
- Certificate:
- View energy certificate on GOV.UK
- Reason for EPC:
- marketed sale
- Tenure:
- Unknown
- Property type:
- End-Terrace House , has 5 habitable rooms. Estimated year built 1976 to 1982
- Area:
- 126 sqm (1,356 square foot) total internal area
- Comments:
- Walls: Cavity wall, as built, partial insulation (assumed). Roof: Roof room(s), limited insulation (assumed). Heating: Boiler and radiators, mains gas.
22 Shingle Bank Drive is worth whatever price a willing buyer and seller agree upon. However, the following can provide useful context.
- HouseMetric estimates the most recent sale price indexed forward to today's value is £701,023.
- Based on an internal area of 126 m² and recent prices in Milford On Sea, this implies a lower and upper quartile range from £549,000 to £719,000, using HouseMetric's implied valuation methodology.
For more detail on HouseMetric data sources, update frequency and valuation methods, see the HouseMetric FAQs.