40, Fakenham Drive, HR4 9UQ
40 Fakenham Drive is a 57 m² terraced home in Hereford. It sold for £167,250 in Jan 2021.
- Sale history
-
Date Paid price Annual growth After inflation Jan 2021 £167,250 * 2.4% 0.9% May 2017 £153,000 6.1% 3.2% Apr 2016 £143,950 -0.0% -0.9% Feb 2015 £144,000 0.8% -1.5% Mar 2008 £136,000 3.4% 0.8% Jan 2005 £122,500 23.8% 22.0% Mar 2001 £53,500 na na *This price paid record has been flagged by Land Registry as a 'Category B: Additional Price Paid entry'. This could be due to a variety of reasons, such as the sale being a buy-to-let purchase, a repossession or a transfer to a limited company. When Land Registry suspects that a sale does not reflect full market value (e.g. part-ownership or right to buy), these transactions can be flagged as well. For this reason, we exclude them from our area statistics.
- Floor plan
-
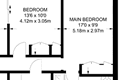
Archived estate agent floor plan for 40, Fakenham Drive.
- Internal area
- 57 square metres (614 square feet) according to latest EPC inspection
- Price per internal area
-
This property sold for £2,934 per square metre (£273 per square foot) in Jan 2021. Indexed forward to today's value, this is roughly £3,561 per square metre (£331 per square foot) .
Date Paid price Paid £/sqm Today's value Today's value £/sqm Jan 2021 £167,250 £2,934 £202,963 £3,561 May 2017 £153,000 £2,684 £201,697 £3,539 Apr 2016 £143,950 £2,525 £198,624 £3,485 Feb 2015 £144,000 £2,526 £211,485 £3,710 Mar 2008 £136,000 £2,386 £203,486 £3,570 Jan 2005 £122,500 £2,149 £208,361 £3,655 Mar 2001 £53,500 £939 £180,537 £3,167 Calculated using the latest EPC internal area of 57 m². Earlier sale dates may not have had the same measured area available.
- Valuation
- The most recent sale price indexed forward to today's value is £202,963. This is one data point to inform the valuation. Another method is the valuation implied by what comparable homes are selling for. Homes in Hereford are now selling for between £2,780 and £3,690 per square metre (£258 and £342 per square foot). Based on an internal area of 57 m², this implies a valuation between £158,000 and £210,000. Treat this as context only. For a valuation using hand-picked comparable sales, use the Advanced search tool — create a shortlist of similar condition homes, then export a valuation report.
- Bedrooms
- 2
- Type
- Terrace
- Council tax band
- B
- Plot size
- 122 square metres (1,313 square feet) - map showing freehold boundary lines
- Title number
- HW55644
- Tenure
- Freehold
- Title address
- 40 Fakenham Drive, Hereford
- Owner
-
T & M PROPERTIES (HEREFORD) LTD
(Company reference number: 12807422)
Proprietor address: 16 Frederick Avenue, Hereford HR1 1HL
Price paid on title: £167,250
Ownership record added to Land Registry's corporate ownership dataset 26 Apr 2021
- History:
- Archived sales listing for 40 Fakenham Drive. Advertised on multiple portals. It was added on 19/09/2020. It last appeared Feb 2021.
- Photos:
-
There are 8 archived estate agent listing photos for 40 Fakenham Drive.
- Advertiser remarks:
-
- 2 bedrooms
- 1 bathrooms

- Summary:
- 17 July 2014 - energy performance certificate grade C
- Reason for EPC:
- Marketed sale
- Tenure:
- Owner-occupied
- Property type:
- Mid-Terrace House , has 3 habitable rooms. Estimated year built 1976 to 1982
- Area:
- 57 sqm (614 square foot) total internal area
- Comments:
- Walls: Timber frame, as built, insulated (assumed). Roof: Pitched, 75 mm loft insulation. Heating: Boiler and radiators, mains gas.