17, The Croft, E4 6EZ
17 The Croft is a 57 m² / 614 sq ft flat in Chingford. It sold for £310,000 in April 2021. Indexed forward to today's value, that sale is roughly £338k. Recent local prices imply a broad valuation context of £295k to £377k based on its internal area. The Land Registry and EPC data was last updated 22 September 2026.
- Sale history
-
Date Paid price Annual growth After inflation Apr 2021 £310,000 -1.0% -2.6% Apr 2017 £322,000 4.6% 2.4% Apr 2007 £205,000 5.9% 3.7% Jan 2003 £161,000 29.5% 29.3% May 2002 £136,000 13.7% 12.0% Sep 1997 £74,000 5.0% 2.4% Dec 1995 £68,000 na na - Floor plan
-
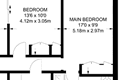
Archived estate agent floor plan for 17, The Croft.
- Internal area
- 57 square metres (614 square feet) according to latest EPC inspection
- Price per internal area
-
This property sold for £5,438 per square metre (£505 per square foot) in Apr 2021. Indexed forward to today's value, this is roughly £5,934 per square metre (£551 per square foot) .
Date Paid price Paid £/sqm Today's value Today's value £/sqm Apr 2021 £310,000 £5,439 £338,266 £5,934 Apr 2017 £322,000 £5,649 £359,997 £6,316 Apr 2007 £205,000 £3,596 £337,291 £5,917 Jan 2003 £161,000 £2,825 £361,612 £6,344 May 2002 £136,000 £2,386 £360,560 £6,326 Sep 1997 £74,000 £1,298 £388,442 £6,815 Dec 1995 £68,000 £1,193 £446,342 £7,831 Calculated using the latest EPC internal area of 57 m². Earlier sale dates may not have had the same measured area available.
- Valuation
- The most recent sale price indexed forward to today's value is £338,266. This is one data point to inform the valuation. Another method is the valuation implied by what comparable homes are selling for. Homes in Chingford are now selling for between £5,180 and £6,620 per square metre (£481 and £615 per square foot). Based on an internal area of 57 m², this implies a valuation between £295,000 and £377,000. Treat this as context only. For a valuation using hand-picked comparable sales, use the Advanced search tool — create a shortlist of similar condition homes, then export a valuation report.
- Bedrooms
- 2
- Type
- Flat
- Council tax band
- D

- Summary:
- 21 December 2016 - energy performance certificate grade C
- Certificate:
- View energy certificate on GOV.UK
- Reason for EPC:
- marketed sale
- Tenure:
- Owner-occupied
- Property type:
- 2nd floor flat in an apartment block with 1 storeys , has 3 habitable rooms. Estimated year built 1991 to 1995
- Area:
- 57 sqm (614 square foot) total internal area
- Comments:
- Walls: Cavity wall, as built, insulated (assumed). Roof: (another dwelling above). Heating: Electric storage heaters.
17 The Croft is worth whatever price a willing buyer and seller agree upon. However, the following can provide useful context.
- HouseMetric estimates the most recent sale price indexed forward to today's value is £338,266.
- Based on an internal area of 57 m² and recent prices in Chingford, this implies a lower and upper quartile range from £295,000 to £377,000, using HouseMetric's implied valuation methodology.
For more detail on HouseMetric data sources, update frequency and valuation methods, see the HouseMetric FAQs.