149, Chalklands, SL8 5TL
149 Chalklands is a 107 m² / 1,152 sq ft detached home in Bourne End. It sold for £755,000 in September 2021. Indexed forward to today's value, that sale is roughly £779k. Recent local prices imply a broad valuation context of £546k to £702k based on its internal area. The Land Registry and EPC data was last updated 8 October 2026.
- Sale history
-
Date Paid price Annual growth After inflation Sep 2021 £755,000 6.8% 5.0% Feb 2012 £400,000 4.9% 2.8% Oct 1997 £199,950 na na - Floor plan
-
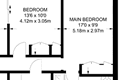
Archived estate agent floor plan for 149, Chalklands.
- Internal area
- 107 square metres (1,152 square feet) according to latest EPC inspection
- Price per internal area
-
This property sold for £7,056 per square metre (£656 per square foot) in Sep 2021. Indexed forward to today's value, this is roughly £7,283 per square metre (£677 per square foot) .
Date Paid price Paid £/sqm Today's value Today's value £/sqm Sep 2021 £755,000 £7,056 £779,329 £7,283 Feb 2012 £400,000 £3,738 £581,120 £5,431 Oct 1997 £199,950 £1,869 £863,969 £8,074 Calculated using the latest EPC internal area of 107 m². Earlier sale dates may not have had the same measured area available.
- Valuation
- The most recent sale price indexed forward to today's value is £779,329. This is one data point to inform the valuation. Another method is the valuation implied by what comparable homes are selling for. Homes in Bourne End are now selling for between £5,100 and £6,560 per square metre (£473 and £609 per square foot). Based on an internal area of 107 m², this implies a valuation between £546,000 and £702,000. Treat this as context only. For a valuation using hand-picked comparable sales, use the Advanced search tool — create a shortlist of similar condition homes, then export a valuation report.
- Bedrooms
- 3
- Type
- Detached
- Council tax band
- F
- Plot size
- 407 square metres (4,381 square feet) - map showing freehold boundary lines

- Summary:
- 04 February 2013 - energy performance certificate grade D
- Certificate:
- View energy certificate on GOV.UK
- Reason for EPC:
- Rental
- Tenure:
- Private rental
- Property type:
- Detached House , has 7 habitable rooms. Estimated year built 1950 to 1966
- Area:
- 107 sqm (1,152 square foot) total internal area
- Comments:
- Walls: Cavity wall, filled cavity. Roof: Pitched, 100 mm loft insulation. Heating: Boiler and radiators, mains gas.
- Summary:
- 21 October 2011 - energy performance certificate grade D
- Certificate:
- View energy certificate on GOV.UK
- Reason for EPC:
- marketed sale
- Tenure:
- Unknown
- Property type:
- Detached House , has 6 habitable rooms. Estimated year built 1950 to 1966
- Area:
- 129 sqm (1,389 square foot) total internal area
- Comments:
- Walls: Cavity wall, filled cavity. Roof: Pitched, 25 mm loft insulation. Heating: Boiler and radiators, mains gas.
149 Chalklands is worth whatever price a willing buyer and seller agree upon. However, the following can provide useful context.
- HouseMetric estimates the most recent sale price indexed forward to today's value is £779,329.
- Based on an internal area of 107 m² and recent prices in Bourne End, this implies a lower and upper quartile range from £546,000 to £702,000, using HouseMetric's implied valuation methodology.
For more detail on HouseMetric data sources, update frequency and valuation methods, see the HouseMetric FAQs.