55, Redbarn Drive, YO10 3JD
55 Redbarn Drive is a 57 m² / 614 sq ft flat in York. It sold for £200,000 in March 2025. Indexed forward to today's value, that sale is roughly £199k. Recent local prices imply a broad valuation context of £177k to £223k based on its internal area. The Land Registry and EPC data was last updated 4 August 2026.
- Sale history
-
Date Paid price Annual growth After inflation Mar 2025 £200,000 3.6% 0.4% Sep 2015 £142,000 4.9% 3.6% Jan 2013 £125,000 2.0% -0.4% Dec 2002 New build New £102,000 na na - Floor plan
-
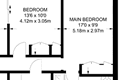
Archived estate agent floor plan for 55, Redbarn Drive.
- Internal area
- 57 square metres (614 square feet) according to latest EPC inspection
- Price per internal area
-
This property sold for £3,508 per square metre (£326 per square foot) in Mar 2025. Indexed forward to today's value, this is roughly £3,494 per square metre (£325 per square foot) .
Date Paid price Paid £/sqm Today's value Today's value £/sqm Mar 2025 £200,000 £3,509 £199,158 £3,494 Sep 2015 £142,000 £2,491 £168,411 £2,955 Jan 2013 £125,000 £2,193 £162,624 £2,853 Dec 2002 £102,000 £1,789 £155,289 £2,724 Calculated using the latest EPC internal area of 57 m². Earlier sale dates may not have had the same measured area available.
- Valuation
- The most recent sale price indexed forward to today's value is £199,158. This is one data point to inform the valuation. Another method is the valuation implied by what comparable homes are selling for. Homes in York are now selling for between £3,100 and £3,910 per square metre (£287 and £363 per square foot). Based on an internal area of 57 m², this implies a valuation between £177,000 and £223,000. Treat this as context only. For a valuation using hand-picked comparable sales, use the Advanced search tool — create a shortlist of similar condition homes, then export a valuation report.
- Bedrooms
- 2
- Type
- Flat
- Council tax band
- B

- Summary:
- 11 December 2024 - energy performance certificate grade B
- Certificate:
- View energy certificate on GOV.UK
- Reason for EPC:
- Marketed sale
- Tenure:
- Owner-occupied
- Property type:
- 2nd floor flat in an apartment block with 1 storeys , has 3 habitable rooms. Estimated year built 2003 to 2006
- Area:
- 57 sqm (614 square foot) total internal area
- Comments:
- Walls: Cavity wall, as built, insulated (assumed). Roof: (another dwelling above). Heating: Boiler and radiators, mains gas.
- Summary:
- 19 April 2011 - energy performance certificate grade C
- Certificate:
- View energy certificate on GOV.UK
- Reason for EPC:
- not sale or rental
- Tenure:
- Unknown
- Property type:
- 2nd floor flat in an apartment block with 1 storeys , has 3 habitable rooms. Estimated year built 2003 to 2006
- Area:
- 53 sqm (570 square foot) total internal area
- Comments:
- Walls: Cavity wall, as built, insulated (assumed). Roof: (another dwelling above). Heating: Boiler and radiators, mains gas.
55 Redbarn Drive is worth whatever price a willing buyer and seller agree upon. However, the following can provide useful context.
- HouseMetric estimates the most recent sale price indexed forward to today's value is £199,158.
- Based on an internal area of 57 m² and recent prices in York, this implies a lower and upper quartile range from £177,000 to £223,000, using HouseMetric's implied valuation methodology.
For more detail on HouseMetric data sources, update frequency and valuation methods, see the HouseMetric FAQs.