Property Snakes & Ladders in TR19
The biggest price drops and jumps on homes sold in the last year, compared with their previous Land Registry sale - curiosity, not analysis.
Rankings from Land Registry resales, last calculated 01 July 2026.
Snakes — biggest house price falls in TR19
The top-ranked TR19 properties with the largest house price falls on resale. Go beyond house price indices with specific examples.
 No. 1
No. 1
4 Boslandew Hill
TR19 6UD · Semi-D · 2 bed
 No. 2
No. 2
Wayside House Penzance Road
TR19 6DZ · Detached · 4 bed
Ladders — largest house price rises in TR19
The top-ranked TR19 properties with the biggest house price rises on resale. Go beyond house price indices with specific examples.
 No. 1
No. 1
Rosteague
TR19 6NJ · Detached
 No. 2
No. 2
Little Paddock Rectory Road
TR19 6BB · Detached · 2 bed
 No. 3
No. 3
10 Bosorne Close
TR19 7JD · Terrace · 3 bed
 No. 4
No. 4
34 Fore Street
TR19 7LJ · Terrace · 4 bed
 No. 5
No. 5
8 Princess Street
TR19 7LD · Terrace · 2 bed
 No. 6
No. 6
3 Lower Sheffield
TR19 6UH · Terrace · 3 bed
 No. 7
No. 7
14 Levant Road
TR19 7SU · Terrace · 3 bed
 No. 8
No. 8
The Pad Botallack Moor
TR19 7QH · Detached · 4 bed
 No. 9
No. 9
10 The Square
TR19 7DN · Terrace · 3 bed
 No. 10
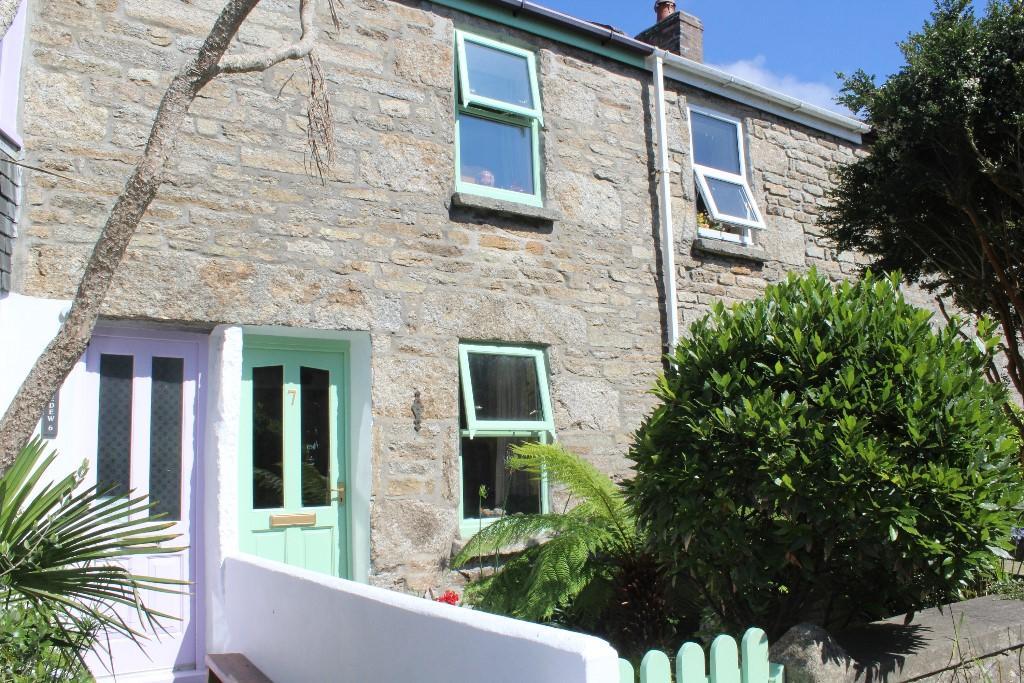
7 Princess Street
TR19 7LD · Terrace · 2 bed
 No. 11
8 Calartha Terrace
TR19 7DX · Terrace
 No. 12
Ding Dong Rectory Road
TR19 6BB · Detached · 4 bed
 No. 13
Mir Y Tiki Nancherrow Terrace
TR19 7LA · Terrace
 No. 14
2 Trungle Parc
TR19 6XB · Detached · 3 bed
 No. 15
36 Boscaswell Village
TR19 7EP · Terrace · 1 bed