Property Snakes & Ladders in Bolsover

The biggest price drops and jumps on homes sold in the last year, compared with their previous Land Registry sale - curiosity, not analysis.

Rankings from Land Registry resales, last calculated 21 September 2026.

Explore another area

Snakes — biggest house price falls in Bolsover

The top-ranked Bolsover properties with the largest house price falls on resale. Go beyond house price indices with specific examples.

Listing photo for 8 George Street No. 1

8 George Street

S70 5AG · Terrace · 2 bed

Was £135,000 (May 2023)
Now £95,000 (Feb 2026)
Price change -£40,000 over 2.7 yrs
Total % -29.6%
Annualised % ↓ 12.0%
Listing photo for Apartment 6 Ladybower Lodge Ashopton Road No. 2

Apartment 6 Ladybower Lodge Ashopton Road

S33 0BY · Flat · 2 bed

Was £350,000 (Nov 2022)
Now £255,000 (Mar 2026)
Price change -£95,000 over 3.3 yrs
Total % -27.1%
Annualised % ↓ 9.2%
Listing photo for 15 Blackburn Crescent No. 3

15 Blackburn Crescent

S35 2EG · Flat · 2 bed

Was £100,000 (Oct 2020)
Now £68,383 (Feb 2026)
Price change -£31,617 over 5.3 yrs
Total % -31.6%
Annualised % ↓ 6.9%
Listing photo for Apartment 57 Smithfield Apartments, 131 Rockingham Street No. 4

Apartment 57 Smithfield Apartments, 131 Rockingham Street

S1 4EY · Flat · 1 bed

Was £88,000 (Jan 2017)
Now £49,500 (Oct 2025)
Price change -£38,500 over 8.8 yrs
Total % -43.8%
Annualised % ↓ 6.4%
Listing photo for 8 Swallow Lane No. 5

8 Swallow Lane

S26 2GR · Semi-D · 3 bed

Was £162,500 (Nov 2017)
Now £95,000 (Apr 2026)
Price change -£67,500 over 8.4 yrs
Total % -41.5%
Annualised % ↓ 6.2%
Listing photo for 534 Carlton Road No. 6

534 Carlton Road

S71 3JE · Detached · 3 bed

Was £290,000 (Jan 2021)
Now £215,000 (Dec 2025)
Price change -£75,000 over 4.9 yrs
Total % -25.9%
Annualised % ↓ 5.9%
Listing photo for 32 King Street No. 7

32 King Street

S35 2YY · Terrace · 3 bed

Was £155,000 (Apr 2017)
Now £93,825 (Jan 2026)
Price change -£61,175 over 8.8 yrs
Total % -39.5%
Annualised % ↓ 5.6%
Listing photo for 49 Newmarch Street No. 8

49 Newmarch Street

S9 1ST · Terrace · 2 bed

Was £64,500 (Dec 2021)
Now £50,000 (May 2026)
Price change -£14,500 over 4.5 yrs
Total % -22.5%
Annualised % ↓ 5.5%
Listing photo for 541 Fulwood Road No. 9

541 Fulwood Road

S10 3QG · Detached · 4 bed

Was £1,150,000 (Jul 2022)
Now £967,500 (Oct 2025)
Price change -£182,500 over 3.2 yrs
Total % -15.9%
Annualised % ↓ 5.2%
Listing photo for Flat 12 Westwood Court Huddersfield Road No. 10

Flat 12 Westwood Court Huddersfield Road

S70 2LT · Flat · 2 bed

Was £70,000 (Dec 2019)
Now £50,000 (Jun 2026)
Price change -£20,000 over 6.5 yrs
Total % -28.6%
Annualised % ↓ 5.0%
Listing photo for 17 Cottongrass Gardens No. 11

17 Cottongrass Gardens

S25 2DE · Detached

Was £299,995 (May 2023)
Now £270,000 (Oct 2025)
Price change -£29,995 over 2.4 yrs
Total % -10.0%
Annualised % ↓ 4.3%
Listing photo for 66 New Street No. 12

66 New Street

S42 5JW · Semi-D · 2 bed

Was £167,000 (Oct 2022)
Now £145,950 (Nov 2025)
Price change -£21,050 over 3.1 yrs
Total % -12.6%
Annualised % ↓ 4.3%
Listing photo for 20 Oak Road No. 13

20 Oak Road

S42 5YB · Detached · 2 bed

Was £195,000 (Jul 2023)
Now £175,000 (Jan 2026)
Price change -£20,000 over 2.5 yrs
Total % -10.3%
Annualised % ↓ 4.2%
Listing photo for 81 Lea Road No. 14

81 Lea Road

S18 1SE · Semi-D · 1 bed

Was £205,000 (Sep 2021)
Now £170,000 (Mar 2026)
Price change -£35,000 over 4.5 yrs
Total % -17.1%
Annualised % ↓ 4.1%
Listing photo for 29 Mcloughlin Way No. 15

29 Mcloughlin Way

S26 6QJ · Semi-D · 3 bed

Was £220,000 (Aug 2023)
Now £202,000 (Sep 2025)
Price change -£18,000 over 2.1 yrs
Total % -8.2%
Annualised % ↓ 4.0%

Ladders — largest house price rises in Bolsover

The top-ranked Bolsover properties with the biggest house price rises on resale. Go beyond house price indices with specific examples.

Listing photo for 363 Hastilar Road South No. 1

363 Hastilar Road South

S13 8EH · Terrace · 3 bed

Was £39,606 (Jul 2023)
Now £135,000 (May 2026)
Price change +£95,394 over 2.9 yrs
Total % 240.9%
Annualised % ↑ 53.2%
Listing photo for 12 Stokewell Road No. 2

12 Stokewell Road

S63 6NE · Terrace · 3 bed

Was £72,000 (Nov 2023)
Now £150,000 (Nov 2025)
Price change +£78,000 over 2.0 yrs
Total % 108.3%
Annualised % ↑ 43.7%
Listing photo for 229 Highcliffe Road No. 3

229 Highcliffe Road

S11 7LQ · Semi-D · 3 bed

Was £250,000 (May 2023)
Now £575,500 (Dec 2025)
Price change +£325,500 over 2.6 yrs
Total % 130.2%
Annualised % ↑ 38.6%
Listing photo for 7a Lindrick Road No. 4

7a Lindrick Road

S81 8RD · Detached

Was £155,000 (Sep 2023)
Now £340,000 (Feb 2026)
Price change +£185,000 over 2.4 yrs
Total % 119.3%
Annualised % ↑ 38.1%
Listing photo for Dellside Common Road No. 5

Dellside Common Road

S72 9ED · Detached · 4 bed

Was £100,000 (Aug 2021)
Now £360,000 (Oct 2025)
Price change +£260,000 over 4.1 yrs
Total % 260.0%
Annualised % ↑ 36.5%
Listing photo for 315 Brimington Road No. 6

315 Brimington Road

S41 0TE · Detached · 3 bed

Was £167,000 (Feb 2024)
Now £345,000 (Jun 2026)
Price change +£178,000 over 2.3 yrs
Total % 106.6%
Annualised % ↑ 36.5%
Listing photo for 44 Queen Victoria Road No. 7

44 Queen Victoria Road

S17 4HT · Detached · 3 bed
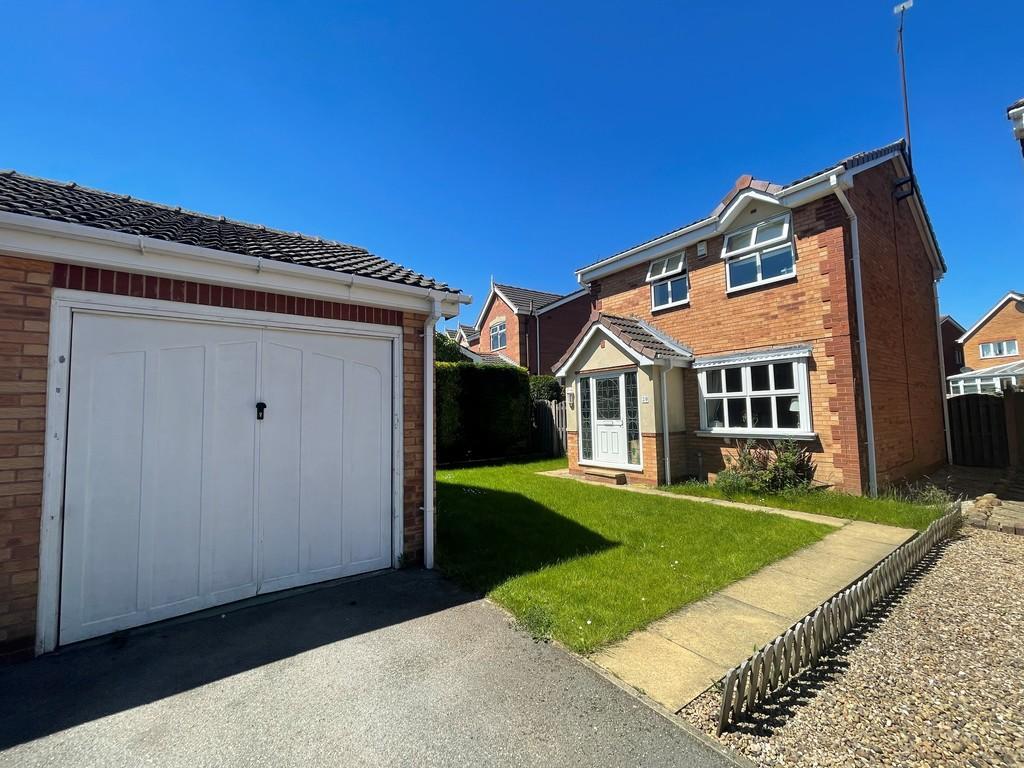
Was £303,000 (Sep 2023)
Now £600,000 (Dec 2025)
Price change +£297,000 over 2.2 yrs
Total % 98.0%
Annualised % ↑ 36.0%
Listing photo for 6 Rose Place No. 8

6 Rose Place

S73 8NF · Semi-D · 3 bed

Was £64,000 (Jul 2023)
Now £153,000 (Jun 2026)
Price change +£89,000 over 2.9 yrs
Total % 139.1%
Annualised % ↑ 34.7%
Listing photo for 259 Cemetery Road No. 9

259 Cemetery Road

S74 0JL · Terrace · 3 bed

Was £61,000 (Dec 2023)
Now £117,000 (Mar 2026)
Price change +£56,000 over 2.3 yrs
Total % 91.8%
Annualised % ↑ 33.0%
Listing photo for 3 Dalewood Drive No. 10

3 Dalewood Drive

S8 0EA · Detached · 4 bed

Was £352,000 (Apr 2022)
Now £975,000 (Jan 2026)
Price change +£623,000 over 3.8 yrs
Total % 177.0%
Annualised % ↑ 31.1%
Listing photo for 10 King Street No. 11

10 King Street

S43 1HX · Terrace · 2 bed

Was £80,000 (Jan 2024)
Now £145,000 (Apr 2026)
Price change +£65,000 over 2.2 yrs
Total % 81.2%
Annualised % ↑ 31.1%
Listing photo for Yard Head Cottage Towngate No. 12

Yard Head Cottage Towngate

S33 9JX · Terrace · 2 bed

Was £160,000 (May 2024)
Now £267,500 (May 2026)
Price change +£107,500 over 2.0 yrs
Total % 67.2%
Annualised % ↑ 29.0%
Listing photo for 74 Manor Road No. 13

74 Manor Road

S43 1NN · Detached · 2 bed

Was £196,500 (May 2023)
Now £350,000 (Oct 2025)
Price change +£153,500 over 2.4 yrs
Total % 78.1%
Annualised % ↑ 26.9%
Listing photo for 62 Church Street No. 14

62 Church Street

S35 0FW · Terrace · 2 bed

Was £130,000 (Apr 2023)
Now £239,000 (Feb 2026)
Price change +£109,000 over 2.8 yrs
Total % 83.9%
Annualised % ↑ 24.5%
Listing photo for 63 Burman Road No. 15

63 Burman Road

S63 7NG · Semi-D · 3 bed

Was £85,000 (Oct 2022)
Now £165,000 (Oct 2025)
Price change +£80,000 over 3.0 yrs
Total % 94.1%
Annualised % ↑ 24.4%

Frequently asked questions

Each entry links sales by the address and property type from Land Registry, with two registered sales at least two years apart. The latest sale was in the last 12 months. Prices are nominal — not adjusted for extensions, condition, or inflation. We show listings with archived photos and floorplans where available (15 snakes, 15 ladders).

A fall is not always a market crash story. Land Registry data input errors, Lease or title changes, part ownership, mis-matched addresses can all influence the numbers. This is not analysis nor is it investment advice, just a bit of fun.

We link sales based on the address and property type provided by Land Registry. We then compare the latest sale to the immediately previous registered sale on that address.

Back to Bolsover house price analysis