Property Snakes & Ladders in Lancaster

The biggest price drops and jumps on homes sold in the last year, compared with their previous Land Registry sale - curiosity, not analysis.

Rankings from Land Registry resales, last calculated 29 October 2026.

Explore another area

Snakes — biggest house price falls in Lancaster

The top-ranked Lancaster properties with the largest house price falls on resale. Go beyond house price indices with specific examples.

Listing photo for Bank End House No. 1

Bank End House

LA17 7XF · Detached

Was £532,500 (Nov 2021)
Now £275,000 (Jul 2026)
Price change -£257,500 over 4.7 yrs
Total % -48.4%
Annualised % ↓ 13.1%
Listing photo for 4 Brampton Drive No. 2

4 Brampton Drive

LA4 6QS · Semi-D · 2 bed

Was £189,500 (Aug 2023)
Now £135,000 (Jun 2026)
Price change -£54,500 over 2.9 yrs
Total % -28.8%
Annualised % ↓ 11.0%
Listing photo for 56 Lord Street No. 3

56 Lord Street

LA18 4BN · Terrace · 2 bed

Was £90,000 (Feb 2023)
Now £65,000 (May 2026)
Price change -£25,000 over 3.3 yrs
Total % -27.8%
Annualised % ↓ 9.5%
Listing photo for 7 Beathwaite Gardens No. 4

7 Beathwaite Gardens

LA8 8NG · Flat · 2 bed

Was £185,000 (Oct 2023)
Now £140,000 (Aug 2026)
Price change -£45,000 over 2.8 yrs
Total % -24.3%
Annualised % ↓ 9.4%
Listing photo for Ballaugh No. 5

Ballaugh

LA12 7TD · Semi-D

Was £214,950 (Jun 2021)
Now £152,000 (Mar 2026)
Price change -£62,950 over 4.7 yrs
Total % -29.3%
Annualised % ↓ 7.1%
Listing photo for 2 Greenfoot Lane No. 6

2 Greenfoot Lane

LA2 7HB · Detached · 2 bed

Was £475,000 (Oct 2023)
Now £425,000 (Dec 2025)
Price change -£50,000 over 2.1 yrs
Total % -10.5%
Annualised % ↓ 5.2%
Listing photo for 17 The Millrace Damside Street No. 7

17 The Millrace Damside Street

LA1 1BL · Flat · 3 bed

Was £210,000 (Oct 2015)
Now £120,500 (Aug 2026)
Price change -£89,500 over 10.8 yrs
Total % -42.6%
Annualised % ↓ 5.0%
Listing photo for 2 Chalk Grove No. 8

2 Chalk Grove

LA9 5FR · Detached

Was £680,000 (Aug 2023)
Now £600,000 (Feb 2026)
Price change -£80,000 over 2.5 yrs
Total % -11.8%
Annualised % ↓ 4.9%
Listing photo for Bankside Lakeber Drive No. 9

Bankside Lakeber Drive

LA2 7JG · Detached

Was £430,000 (Apr 2022)
Now £365,000 (Oct 2025)
Price change -£65,000 over 3.6 yrs
Total % -15.1%
Annualised % ↓ 4.5%
Listing photo for 2 Railway Cottages No. 10

2 Railway Cottages

LA12 8AW · Terrace · 2 bed

Was £330,000 (Dec 2021)
Now £270,000 (Jun 2026)
Price change -£60,000 over 4.5 yrs
Total % -18.2%
Annualised % ↓ 4.3%
Listing photo for 8 Anchorite Fields No. 11

8 Anchorite Fields

LA9 5NG · Terrace · 4 bed

Was £270,000 (Jan 2011)
Now £140,000 (May 2026)
Price change -£130,000 over 15.3 yrs
Total % -48.1%
Annualised % ↓ 4.2%
Listing photo for 21 Blackhall Croft Blackhall Road No. 12

21 Blackhall Croft Blackhall Road

LA9 4UU · Flat · 1 bed

Was £112,000 (Sep 2018)
Now £83,500 (Dec 2025)
Price change -£28,500 over 7.2 yrs
Total % -25.4%
Annualised % ↓ 4.0%
Listing photo for Burrow Cottage No. 13

Burrow Cottage

LA6 2RJ · Semi-D · 3 bed

Was £605,000 (Jun 2021)
Now £500,000 (Apr 2026)
Price change -£105,000 over 4.8 yrs
Total % -17.4%
Annualised % ↓ 3.9%
Listing photo for 10 Millers Ford No. 14

10 Millers Ford

LA2 7BF · Flat · 2 bed
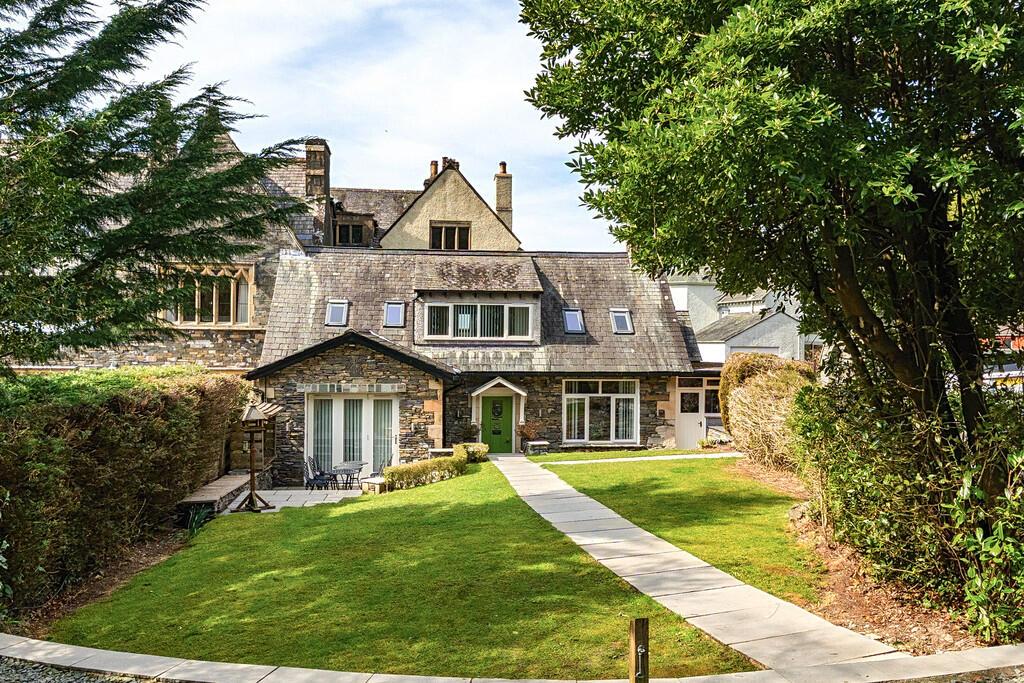
Was £195,000 (Jan 2022)
Now £170,000 (Jan 2026)
Price change -£25,000 over 4.0 yrs
Total % -12.8%
Annualised % ↓ 3.4%
Listing photo for The Croft Oakland Carriage Drive No. 15

The Croft Oakland Carriage Drive

LA23 1SA · Detached · 3 bed

Was £675,000 (Sep 2022)
Now £600,000 (Mar 2026)
Price change -£75,000 over 3.5 yrs
Total % -11.1%
Annualised % ↓ 3.3%

Ladders — largest house price rises in Lancaster

The top-ranked Lancaster properties with the biggest house price rises on resale. Go beyond house price indices with specific examples.

Listing photo for 18 South Avenue No. 1

18 South Avenue

LA4 5RJ · Semi-D · 3 bed

Was £155,000 (Oct 2023)
Now £335,000 (Nov 2025)
Price change +£180,000 over 2.1 yrs
Total % 116.1%
Annualised % ↑ 45.3%
Listing photo for 20 Hawesmead Drive No. 2

20 Hawesmead Drive

LA9 5HD · Semi-D · 3 bed

Was £172,500 (Jun 2024)
Now £350,000 (Jul 2026)
Price change +£177,500 over 2.0 yrs
Total % 102.9%
Annualised % ↑ 41.3%
Listing photo for 12 Hillmount Avenue No. 3

12 Hillmount Avenue

LA3 2DQ · Semi-D · 3 bed

Was £135,000 (Mar 2023)
Now £285,000 (Nov 2025)
Price change +£150,000 over 2.6 yrs
Total % 111.1%
Annualised % ↑ 32.8%
Listing photo for Hollace No. 4

Hollace

LA21 8BH · Detached

Was £250,000 (Jan 2023)
Now £650,000 (Jun 2026)
Price change +£400,000 over 3.4 yrs
Total % 160.0%
Annualised % ↑ 32.5%
Listing photo for 57 Egerton Terrace No. 5

57 Egerton Terrace

LA15 8HX · Terrace · 2 bed

Was £73,000 (Dec 2022)
Now £157,000 (Dec 2025)
Price change +£84,000 over 3.0 yrs
Total % 115.1%
Annualised % ↑ 29.4%
Listing photo for 75 Westminster Road No. 6

75 Westminster Road

LA4 4JE · Terrace · 5 bed
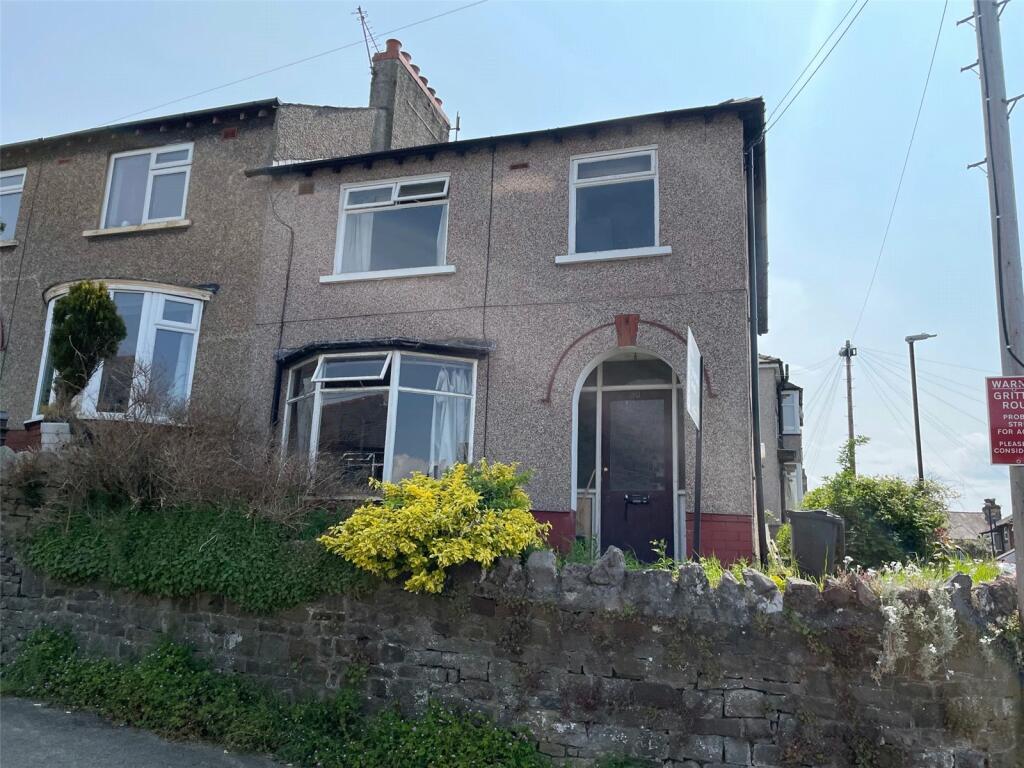
Was £95,000 (Jun 2023)
Now £191,000 (Aug 2026)
Price change +£96,000 over 3.2 yrs
Total % 101.0%
Annualised % ↑ 24.2%
Listing photo for 30 Wharfedale Road No. 7

30 Wharfedale Road

LA1 5ND · Semi-D · 3 bed

Was £102,500 (Aug 2023)
Now £193,000 (Aug 2026)
Price change +£90,500 over 3.0 yrs
Total % 88.3%
Annualised % ↑ 23.3%
Listing photo for 120 Lingmoor Rise No. 8

120 Lingmoor Rise

LA9 7NU · Semi-D

Was £76,000 (Sep 2023)
Now £122,000 (Dec 2025)
Price change +£46,000 over 2.3 yrs
Total % 60.5%
Annualised % ↑ 22.9%
Listing photo for 45 Slyne Road No. 9

45 Slyne Road

LA1 2JH · Terrace · 3 bed

Was £125,000 (May 2023)
Now £208,500 (Dec 2025)
Price change +£83,500 over 2.5 yrs
Total % 66.8%
Annualised % ↑ 22.2%
Listing photo for 33 Parry Street No. 10

33 Parry Street

LA14 5TF · Terrace · 2 bed

Was £52,500 (Nov 2023)
Now £77,500 (Dec 2025)
Price change +£25,000 over 2.1 yrs
Total % 47.6%
Annualised % ↑ 20.8%
Listing photo for 32 Yarlside Road No. 11

32 Yarlside Road

LA13 0ER · Semi-D · 3 bed

Was £126,000 (Nov 2022)
Now £238,500 (May 2026)
Price change +£112,500 over 3.5 yrs
Total % 89.3%
Annualised % ↑ 20.2%
Listing photo for 44 Mallowdale Avenue No. 12

44 Mallowdale Avenue

LA3 2ES · Terrace · 3 bed

Was £115,000 (Oct 2023)
Now £195,000 (Sep 2026)
Price change +£80,000 over 2.9 yrs
Total % 69.6%
Annualised % ↑ 19.8%
Listing photo for 43 Chester Street No. 13

43 Chester Street

LA14 4AL · Terrace · 2 bed

Was £63,000 (Feb 2024)
Now £89,950 (Feb 2026)
Price change +£26,950 over 2.0 yrs
Total % 42.8%
Annualised % ↑ 19.3%
Listing photo for 21 Queen Street No. 14

21 Queen Street

LA18 4BG · Terrace

Was £45,555 (Dec 2021)
Now £95,000 (Feb 2026)
Price change +£49,445 over 4.2 yrs
Total % 108.5%
Annualised % ↑ 19.3%
Listing photo for 11 Thorpe Avenue No. 15

11 Thorpe Avenue

LA4 6NG · Semi-D · 3 bed

Was £150,000 (Oct 2023)
Now £250,000 (Sep 2026)
Price change +£100,000 over 2.9 yrs
Total % 66.7%
Annualised % ↑ 19.3%

Frequently asked questions

Each entry links sales by the address and property type from Land Registry, with two registered sales at least two years apart. The latest sale was in the last 12 months. Prices are nominal — not adjusted for extensions, condition, or inflation. We show listings with archived photos and floorplans where available (15 snakes, 15 ladders).

A fall is not always a market crash story. Land Registry data input errors, Lease or title changes, part ownership, mis-matched addresses can all influence the numbers. This is not analysis nor is it investment advice, just a bit of fun.

We link sales based on the address and property type provided by Land Registry. We then compare the latest sale to the immediately previous registered sale on that address.

Back to Lancaster house price analysis