Property Snakes & Ladders in BS21 5

The biggest price drops and jumps on homes sold in the last year, compared with their previous Land Registry sale - curiosity, not analysis.

Rankings from Land Registry resales, last calculated 01 July 2026.

Explore another area

Snakes — biggest house price falls in BS21 5

The top-ranked BS21 5 properties with the largest house price falls on resale. Go beyond house price indices with specific examples.
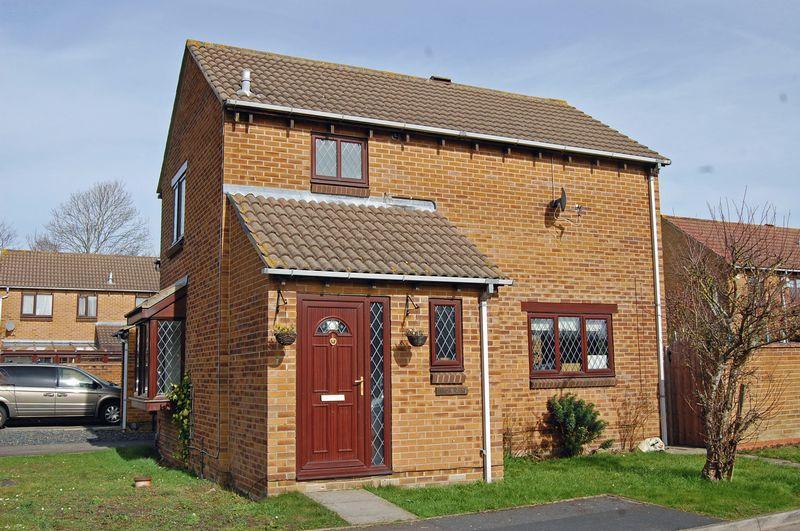
Listing photo for 5 Parsons Green No. 1

5 Parsons Green

BS21 5HR · Detached · 3 bed

Was £315,000 (Sep 2020)
Now £175,000 (Sep 2025)
Price change -£140,000 over 5.0 yrs
Total % -44.4%
Annualised % ↓ 11.1%

Ladders — largest house price rises in BS21 5

The top-ranked BS21 5 properties with the biggest house price rises on resale. Go beyond house price indices with specific examples.

Listing photo for 17 Woodington Road No. 1

17 Woodington Road

BS21 5LB · Semi-D · 3 bed

Was £268,000 (Jul 2016)
Now £525,000 (Nov 2025)
Price change +£257,000 over 9.3 yrs
Total % 95.9%
Annualised % ↑ 7.5%
Listing photo for 21 Blackthorn Square No. 2

21 Blackthorn Square

BS21 5EF · Semi-D · 3 bed

Was £48,000 (Nov 1996)
Now £320,000 (Sep 2025)
Price change +£272,000 over 28.9 yrs
Total % 566.7%
Annualised % ↑ 6.8%
Listing photo for 20 Wrangle Farm Green No. 3

20 Wrangle Farm Green

BS21 5DR · Terrace · 3 bed

Was £273,000 (Sep 2017)
Now £440,000 (Dec 2025)
Price change +£167,000 over 8.2 yrs
Total % 61.2%
Annualised % ↑ 6.0%
Listing photo for 59 Elgar Close No. 4

59 Elgar Close

BS21 5BS · Semi-D · 3 bed

Was £180,000 (Apr 2013)
Now £365,000 (Aug 2025)
Price change +£185,000 over 12.3 yrs
Total % 102.8%
Annualised % ↑ 5.9%
Listing photo for 33 Sercombe Park No. 5

33 Sercombe Park

BS21 5BD · Detached · 2 bed

Was £54,500 (Feb 1995)
Now £303,000 (Jul 2025)
Price change +£248,500 over 30.4 yrs
Total % 456.0%
Annualised % ↑ 5.8%
Listing photo for 16 Ruddymead No. 6

16 Ruddymead

BS21 5EN · Terrace · 3 bed

Was £68,500 (Nov 1998)
Now £300,000 (Oct 2025)
Price change +£231,500 over 26.9 yrs
Total % 338.0%
Annualised % ↑ 5.6%
Listing photo for 25 Hurn Road No. 7

25 Hurn Road

BS21 5AF · Semi-D · 4 bed

Was £230,000 (Jun 2014)
Now £399,950 (Oct 2025)
Price change +£169,950 over 11.3 yrs
Total % 73.9%
Annualised % ↑ 5.0%
Listing photo for 3 Freelands No. 8

3 Freelands

BS21 5HS · Detached · 3 bed

Was £107,000 (Sep 2000)
Now £360,000 (Aug 2025)
Price change +£253,000 over 24.9 yrs
Total % 236.5%
Annualised % ↑ 5.0%
Listing photo for 43 Braikenridge Close No. 9

43 Braikenridge Close

BS21 5LA · Terrace · 3 bed

Was £270,000 (Oct 2019)
Now £352,500 (Jul 2025)
Price change +£82,500 over 5.7 yrs
Total % 30.6%
Annualised % ↑ 4.8%
Listing photo for 19 Cannons Gate No. 10

19 Cannons Gate

BS21 5HJ · Terrace · 3 bed

Was £115,000 (Jan 2001)
Now £360,000 (Aug 2025)
Price change +£245,000 over 24.6 yrs
Total % 213.0%
Annualised % ↑ 4.8%
Listing photo for 47 Yeoward Road No. 11

47 Yeoward Road

BS21 5AT · Terrace · 3 bed

Was £215,000 (Jan 2016)
Now £345,000 (Apr 2026)
Price change +£130,000 over 10.3 yrs
Total % 60.5%
Annualised % ↑ 4.7%
Listing photo for 30 Chipping Cross No. 12

30 Chipping Cross

BS21 5JE · Detached · 3 bed

Was £195,000 (Aug 2011)
Now £375,000 (Nov 2025)
Price change +£180,000 over 14.3 yrs
Total % 92.3%
Annualised % ↑ 4.7%
Listing photo for 21 Kenn Moor Drive No. 13

21 Kenn Moor Drive

BS21 5AR · Terrace · 2 bed

Was £166,500 (Sep 2013)
Now £284,000 (Jul 2025)
Price change +£117,500 over 11.9 yrs
Total % 70.6%
Annualised % ↑ 4.6%
Listing photo for 51 Chipping Cross No. 14

51 Chipping Cross

BS21 5JG · Semi-D · 4 bed

Was £127,500 (Dec 2000)
Now £383,450 (Jul 2025)
Price change +£255,950 over 24.6 yrs
Total % 200.7%
Annualised % ↑ 4.6%
Listing photo for 8 Fosseway No. 15

8 Fosseway

BS21 5EB · Terrace · 3 bed

Was £155,000 (Oct 2011)
Now £289,950 (Nov 2025)
Price change +£134,950 over 14.1 yrs
Total % 87.1%
Annualised % ↑ 4.5%

Frequently asked questions

Each entry links sales by the address and property type from Land Registry, with two registered sales at least two years apart. The latest sale was in the last 12 months. Prices are nominal — not adjusted for extensions, condition, or inflation. We show listings with archived photos and floorplans where available (15 snakes, 15 ladders).

A fall is not always a market crash story. Land Registry data input errors, Lease or title changes, part ownership, mis-matched addresses can all influence the numbers. This is not analysis nor is it investment advice, just a bit of fun.

We link sales based on the address and property type provided by Land Registry. We then compare the latest sale to the immediately previous registered sale on that address.

Back to BS21 5 house price analysis