Property Snakes & Ladders in CF37 2

The biggest price drops and jumps on homes sold in the last year, compared with their previous Land Registry sale - curiosity, not analysis.

Rankings from Land Registry resales, last calculated 05 June 2026.

Explore another area

Snakes — biggest house price falls in CF37 2

The top-ranked CF37 2 properties with the largest house price falls on resale. Go beyond house price indices with specific examples.
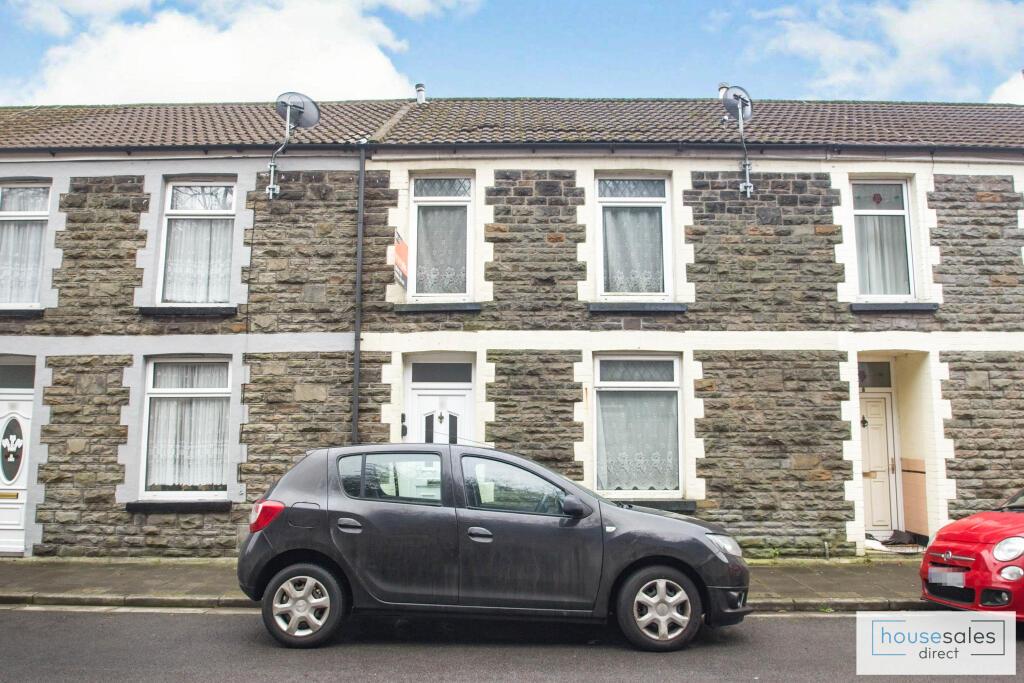
Listing photo for 9 Fountain Street No. 1

9 Fountain Street

CF37 2LS · Terrace · 3 bed

Was £89,000 (Jun 2023)
Now £80,000 (Aug 2025)
Price change -£9,000 over 2.2 yrs
Total % -10.1%
Annualised % ↓ 4.7%

Ladders — largest house price rises in CF37 2

The top-ranked CF37 2 properties with the biggest house price rises on resale. Go beyond house price indices with specific examples.

Listing photo for 25 Whiterock Drive No. 1

25 Whiterock Drive

CF37 2HA · Semi-D · 3 bed

Was £185,000 (Sep 2020)
Now £370,000 (Sep 2025)
Price change +£185,000 over 5.0 yrs
Total % 100.0%
Annualised % ↑ 14.9%
Listing photo for 9 Rheolau Terrace No. 2

9 Rheolau Terrace

CF37 2NS · Terrace · 3 bed

Was £86,000 (Jul 2021)
Now £135,000 (Oct 2025)
Price change +£49,000 over 4.2 yrs
Total % 57.0%
Annualised % ↑ 11.3%
Listing photo for 48 Telelkebir Road No. 3

48 Telelkebir Road

CF37 2RL · Terrace · 3 bed

Was £97,500 (May 2018)
Now £175,000 (Feb 2026)
Price change +£77,500 over 7.8 yrs
Total % 79.5%
Annualised % ↑ 7.8%
Listing photo for 4 Castle Ivor Street No. 4

4 Castle Ivor Street

CF37 2PY · Terrace · 2 bed

Was £60,000 (Jun 2016)
Now £111,500 (Aug 2025)
Price change +£51,500 over 9.2 yrs
Total % 85.8%
Annualised % ↑ 7.0%
Listing photo for 34 Rheolau Terrace No. 5

34 Rheolau Terrace

CF37 2NS · Semi-D

Was £18,000 (Dec 2001)
Now £85,000 (Aug 2025)
Price change +£67,000 over 23.6 yrs
Total % 372.2%
Annualised % ↑ 6.8%
Listing photo for 71 Pantygraigwen Road No. 6

71 Pantygraigwen Road

CF37 2RS · Semi-D · 3 bed

Was £117,000 (Apr 2021)
Now £152,500 (Sep 2025)
Price change +£35,500 over 4.4 yrs
Total % 30.3%
Annualised % ↑ 6.2%
Listing photo for 26 Wayne Street No. 7

26 Wayne Street

CF37 2NL · Terrace · 3 bed

Was £92,000 (Jan 2019)
Now £135,000 (Aug 2025)
Price change +£43,000 over 6.6 yrs
Total % 46.7%
Annualised % ↑ 5.9%
Listing photo for 6 Telelkebir Road No. 8

6 Telelkebir Road

CF37 2RL · Terrace · 3 bed

Was £100,000 (Jun 2019)
Now £139,500 (Apr 2026)
Price change +£39,500 over 6.8 yrs
Total % 39.5%
Annualised % ↑ 5.0%
Listing photo for 8 Hurford Crescent No. 9

8 Hurford Crescent

CF37 2LD · Terrace · 2 bed

Was £75,000 (Jul 2019)
Now £99,995 (Jul 2025)
Price change +£24,995 over 6.1 yrs
Total % 33.3%
Annualised % ↑ 4.9%
Listing photo for 6 Colliery Street No. 10

6 Colliery Street

CF37 2NB · Semi-D · 4 bed

Was £86,000 (Jun 2017)
Now £125,000 (Sep 2025)
Price change +£39,000 over 8.3 yrs
Total % 45.4%
Annualised % ↑ 4.6%
Listing photo for 41 Park Prospect No. 11

41 Park Prospect

CF37 2HF · Detached · 3 bed

Was £172,250 (Oct 2011)
Now £320,000 (Jul 2025)
Price change +£147,750 over 13.7 yrs
Total % 85.8%
Annualised % ↑ 4.6%
Listing photo for 56 Hopkinstown Road No. 12

56 Hopkinstown Road

CF37 2PS · Terrace · 2 bed

Was £69,000 (Oct 2006)
Now £160,000 (Feb 2026)
Price change +£91,000 over 19.3 yrs
Total % 131.9%
Annualised % ↑ 4.5%
Listing photo for 13 Hillside View No. 13

13 Hillside View

CF37 2LF · Terrace · 2 bed

Was £95,000 (May 2013)
Now £163,000 (Nov 2025)
Price change +£68,000 over 12.4 yrs
Total % 71.6%
Annualised % ↑ 4.4%
Listing photo for 7 Ivy Terrace No. 14

7 Ivy Terrace

CF37 2SB · Terrace · 1 bed

Was £130,000 (Aug 2022)
Now £146,500 (Oct 2025)
Price change +£16,500 over 3.1 yrs
Total % 12.7%
Annualised % ↑ 3.9%
Listing photo for 49 Pantygraigwen Road No. 15

49 Pantygraigwen Road

CF37 2RS · Detached · 3 bed

Was £182,500 (Apr 2017)
Now £245,000 (Oct 2025)
Price change +£62,500 over 8.5 yrs
Total % 34.2%
Annualised % ↑ 3.5%

Frequently asked questions

Each entry links sales by the address and property type from Land Registry, with two registered sales at least two years apart. The latest sale was in the last 12 months. Prices are nominal — not adjusted for extensions, condition, or inflation. We show listings with archived photos and floorplans where available (15 snakes, 15 ladders).

A fall is not always a market crash story. Land Registry data input errors, Lease or title changes, part ownership, mis-matched addresses can all influence the numbers. This is not analysis nor is it investment advice, just a bit of fun.

We link sales based on the address and property type provided by Land Registry. We then compare the latest sale to the immediately previous registered sale on that address.

Back to CF37 2 house price analysis