Property Snakes & Ladders in CF62 8

The biggest price drops and jumps on homes sold in the last year, compared with their previous Land Registry sale - curiosity, not analysis.

Rankings from Land Registry resales, last calculated 05 June 2026.

Explore another area

Snakes — biggest house price falls in CF62 8

The top-ranked CF62 8 properties with the largest house price falls on resale. Go beyond house price indices with specific examples.
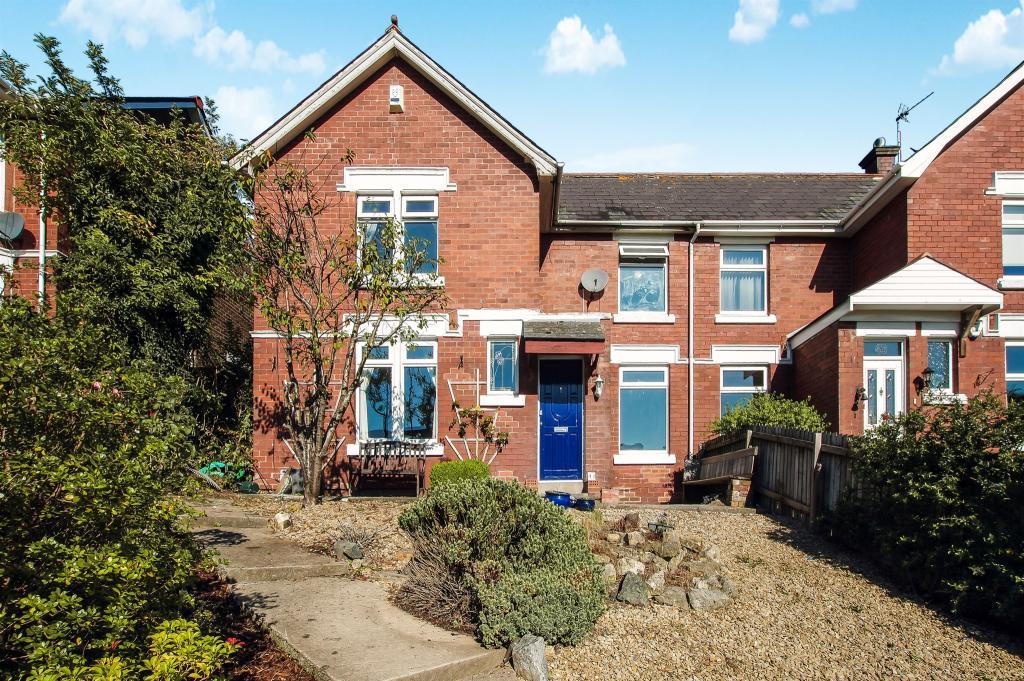
Listing photo for 10 St Andrews Road No. 1

10 St Andrews Road

CF62 8BR · Semi-D · 3 bed

Was £245,000 (Aug 2023)
Now £240,000 (Aug 2025)
Price change -£5,000 over 2.0 yrs
Total % -2.0%
Annualised % ↓ 1.0%

Ladders — largest house price rises in CF62 8

The top-ranked CF62 8 properties with the biggest house price rises on resale. Go beyond house price indices with specific examples.

Listing photo for 82 Tynewydd Road No. 1

82 Tynewydd Road

CF62 8BB · Terrace · 4 bed

Was £190,000 (Jan 2022)
Now £270,000 (Jun 2025)
Price change +£80,000 over 3.4 yrs
Total % 42.1%
Annualised % ↑ 10.9%
Listing photo for 15 Sandringham Close No. 2

15 Sandringham Close

CF62 8BD · Detached · 4 bed

Was £245,000 (Nov 2019)
Now £395,000 (Dec 2025)
Price change +£150,000 over 6.1 yrs
Total % 61.2%
Annualised % ↑ 8.2%
Listing photo for 44 Tynewydd Road No. 3

44 Tynewydd Road

CF62 8AZ · Terrace · 4 bed

Was £37,950 (Jul 1999)
Now £280,000 (Feb 2026)
Price change +£242,050 over 26.6 yrs
Total % 637.8%
Annualised % ↑ 7.8%
Listing photo for 40 College Road No. 4

40 College Road

CF62 8HQ · Semi-D

Was £135,000 (Jul 2015)
Now £260,000 (Aug 2025)
Price change +£125,000 over 10.0 yrs
Total % 92.6%
Annualised % ↑ 6.8%
Listing photo for 22 Newlands Street No. 5

22 Newlands Street

CF62 8EA · Terrace · 3 bed

Was £158,000 (Jan 2019)
Now £240,000 (Aug 2025)
Price change +£82,000 over 6.5 yrs
Total % 51.9%
Annualised % ↑ 6.6%
Listing photo for 11 Woodham Park No. 6

11 Woodham Park

CF62 8JF · Terrace · 3 bed

Was £141,000 (Sep 2016)
Now £245,000 (Aug 2025)
Price change +£104,000 over 9.0 yrs
Total % 73.8%
Annualised % ↑ 6.4%
Listing photo for 45 Lombard Street No. 7

45 Lombard Street

CF62 8DQ · Terrace · 2 bed

Was £156,000 (Jun 2021)
Now £210,000 (Mar 2026)
Price change +£54,000 over 4.8 yrs
Total % 34.6%
Annualised % ↑ 6.4%
Listing photo for 24 Hollyrood Close No. 8

24 Hollyrood Close

CF62 8AX · Detached · 5 bed

Was £226,000 (Jun 2021)
Now £285,000 (Jul 2025)
Price change +£59,000 over 4.0 yrs
Total % 26.1%
Annualised % ↑ 5.9%
Listing photo for 15 Highlight Lane No. 9

15 Highlight Lane

CF62 8AA · Detached · 4 bed

Was £370,000 (Dec 2020)
Now £475,000 (Oct 2025)
Price change +£105,000 over 4.8 yrs
Total % 28.4%
Annualised % ↑ 5.3%
Listing photo for 187 Gladstone Road No. 10

187 Gladstone Road

CF62 8NB · Terrace · 4 bed

Was £209,950 (Jan 2019)
Now £285,000 (Aug 2025)
Price change +£75,050 over 6.5 yrs
Total % 35.8%
Annualised % ↑ 4.8%
Listing photo for 16 Beryl Road No. 11

16 Beryl Road

CF62 8DN · Semi-D · 3 bed

Was £139,000 (Jul 2015)
Now £220,000 (Aug 2025)
Price change +£81,000 over 10.1 yrs
Total % 58.3%
Annualised % ↑ 4.7%
Listing photo for 4 Beryl Place No. 12

4 Beryl Place

CF62 8DL · Semi-D · 2 bed

Was £135,000 (Jun 2011)
Now £260,000 (Nov 2025)
Price change +£125,000 over 14.5 yrs
Total % 92.6%
Annualised % ↑ 4.6%
Listing photo for 29 Newlands Street No. 13

29 Newlands Street

CF62 8EA · Terrace · 3 bed

Was £124,950 (Apr 2006)
Now £257,000 (Dec 2025)
Price change +£132,050 over 19.6 yrs
Total % 105.7%
Annualised % ↑ 3.7%
Listing photo for 41 St Pauls Avenue No. 14

41 St Pauls Avenue

CF62 8HU · Semi-D · 3 bed

Was £210,000 (Nov 2018)
Now £270,000 (Jan 2026)
Price change +£60,000 over 7.1 yrs
Total % 28.6%
Annualised % ↑ 3.6%
Listing photo for 151 Woodlands Road No. 15

151 Woodlands Road

CF62 8ED · Terrace · 4 bed

Was £118,000 (Mar 2004)
Now £250,000 (Apr 2026)
Price change +£132,000 over 22.1 yrs
Total % 111.9%
Annualised % ↑ 3.5%

Frequently asked questions

Each entry links sales by the address and property type from Land Registry, with two registered sales at least two years apart. The latest sale was in the last 12 months. Prices are nominal — not adjusted for extensions, condition, or inflation. We show listings with archived photos and floorplans where available (15 snakes, 15 ladders).

A fall is not always a market crash story. Land Registry data input errors, Lease or title changes, part ownership, mis-matched addresses can all influence the numbers. This is not analysis nor is it investment advice, just a bit of fun.

We link sales based on the address and property type provided by Land Registry. We then compare the latest sale to the immediately previous registered sale on that address.

Back to CF62 8 house price analysis