Property Snakes & Ladders in CW2 8
The biggest price drops and jumps on homes sold in the last year, compared with their previous Land Registry sale - curiosity, not analysis.
Rankings from Land Registry resales, last calculated 01 July 2026.
Ladders — largest house price rises in CW2 8
The top-ranked CW2 8 properties with the biggest house price rises on resale. Go beyond house price indices with specific examples.
 No. 1
No. 1
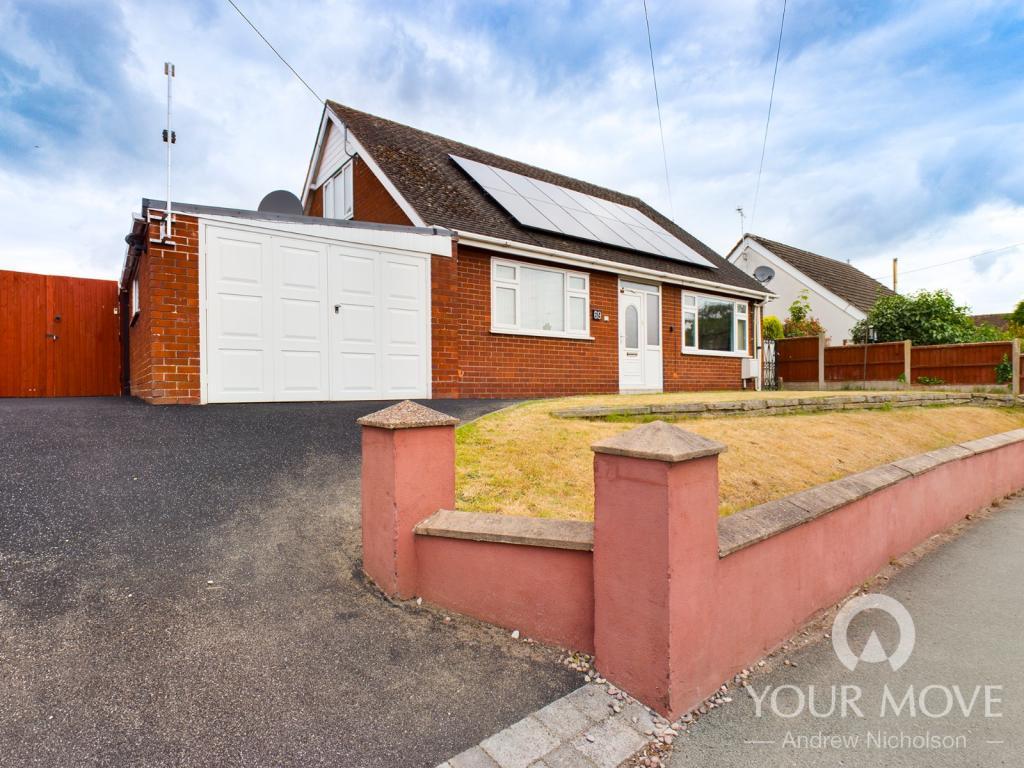
69 Church Lane
CW2 8EZ · Detached · 2 bed
Was
£215,000 (Jul 2023)
Now
£375,000 (Dec 2025)
Price change
+£160,000 over 2.4 yrs
Total %
74.4%
Annualised %
↑ 25.5%
 No. 2
No. 2
25 Merrills Avenue
CW2 8SP · Semi-D · 2 bed
Was
£145,000 (Dec 2022)
Now
£212,500 (Dec 2025)
Price change
+£67,500 over 3.0 yrs
Total %
46.6%
Annualised %
↑ 13.6%
 No. 3
No. 3
18 Clyde Grove
CW2 8NA · Semi-D · 3 bed
Was
£135,000 (Jul 2019)
Now
£250,000 (Aug 2025)
Price change
+£115,000 over 6.1 yrs
Total %
85.2%
Annualised %
↑ 10.6%
 No. 4
No. 4
28 Christleton Avenue
CW2 8TD · Semi-D · 3 bed
Was
£110,000 (Sep 2018)
Now
£210,000 (Dec 2025)
Price change
+£100,000 over 7.3 yrs
Total %
90.9%
Annualised %
↑ 9.3%
 No. 5
No. 5
4 Brookland Avenue
CW2 8EJ · Semi-D · 5 bed
Was
£87,000 (Mar 2008)
Now
£375,000 (Jul 2025)
Price change
+£288,000 over 17.3 yrs
Total %
331.0%
Annualised %
↑ 8.8%
 No. 6
No. 6
23 Westfield Drive
CW2 8EU · Detached · 2 bed
Was
£280,000 (Aug 2021)
Now
£395,000 (Sep 2025)
Price change
+£115,000 over 4.1 yrs
Total %
41.1%
Annualised %
↑ 8.8%
 No. 7
No. 7
158 Stewart Street
CW2 8LZ · Semi-D · 3 bed
Was
£163,500 (Dec 2020)
Now
£240,000 (Dec 2025)
Price change
+£76,500 over 5.0 yrs
Total %
46.8%
Annualised %
↑ 8.0%
 No. 8
No. 8
86 Dane Bank Avenue
CW2 8AF · Semi-D · 3 bed
Was
£142,500 (Jan 2021)
Now
£200,000 (Aug 2025)
Price change
+£57,500 over 4.6 yrs
Total %
40.4%
Annualised %
↑ 7.7%
 No. 9
No. 9
27 Blunstone Close
CW2 8LS · Semi-D · 3 bed
Was
£166,000 (May 2021)
Now
£227,000 (Oct 2025)
Price change
+£61,000 over 4.4 yrs
Total %
36.8%
Annualised %
↑ 7.4%
 No. 10
138 Wistaston Green Road
CW2 8RA · Semi-D · 3 bed
Was
£33,500 (May 1999)
Now
£210,000 (Aug 2025)
Price change
+£176,500 over 26.2 yrs
Total %
526.9%
Annualised %
↑ 7.2%
 No. 11
32 Manor Avenue
CW2 8BD · Detached · 4 bed
Was
£234,000 (Feb 2013)
Now
£555,000 (Mar 2026)
Price change
+£321,000 over 13.1 yrs
Total %
137.2%
Annualised %
↑ 6.8%
 No. 12
99 Church Lane
CW2 8ER · Semi-D · 4 bed
Was
£180,000 (Mar 2016)
Now
£330,000 (Oct 2025)
Price change
+£150,000 over 9.5 yrs
Total %
83.3%
Annualised %
↑ 6.6%
 No. 13
4 Pen Road
CW2 8WL · Semi-D
Was
£205,995 (Aug 2020)
Now
£285,000 (Oct 2025)
Price change
+£79,005 over 5.2 yrs
Total %
38.4%
Annualised %
↑ 6.5%
 No. 14
36 Kings Drive
CW2 8HT · Semi-D · 3 bed
Was
£180,000 (Jul 2016)
Now
£320,000 (Nov 2025)
Price change
+£140,000 over 9.4 yrs
Total %
77.8%
Annualised %
↑ 6.3%
 No. 15
35 Hargrave Avenue
CW2 8NW · Terrace · 3 bed
Was
£145,000 (May 2021)
Now
£190,000 (Dec 2025)
Price change
+£45,000 over 4.6 yrs
Total %
31.0%
Annualised %
↑ 6.0%
Frequently asked questions
Each entry links sales by the address and property type from Land Registry, with two registered sales at least two years apart.
The latest sale was in the last 12 months. Prices are nominal — not adjusted for extensions, condition, or inflation.
We show listings with archived photos and floorplans where available (15 snakes, 15 ladders).
A fall is not always a market crash story. Land Registry data input errors, Lease or title changes, part ownership, mis-matched addresses can all influence the numbers.
This is not analysis nor is it investment advice, just a bit of fun.
We link sales based on the address and property type provided by Land Registry. We then compare the latest sale to the immediately previous registered sale on that address.