Property Snakes & Ladders in NG5 8
The biggest price drops and jumps on homes sold in the last year, compared with their previous Land Registry sale - curiosity, not analysis.
Rankings from Land Registry resales, last calculated 01 July 2026.
Ladders — largest house price rises in NG5 8
The top-ranked NG5 8 properties with the biggest house price rises on resale. Go beyond house price indices with specific examples.
 No. 1
No. 1
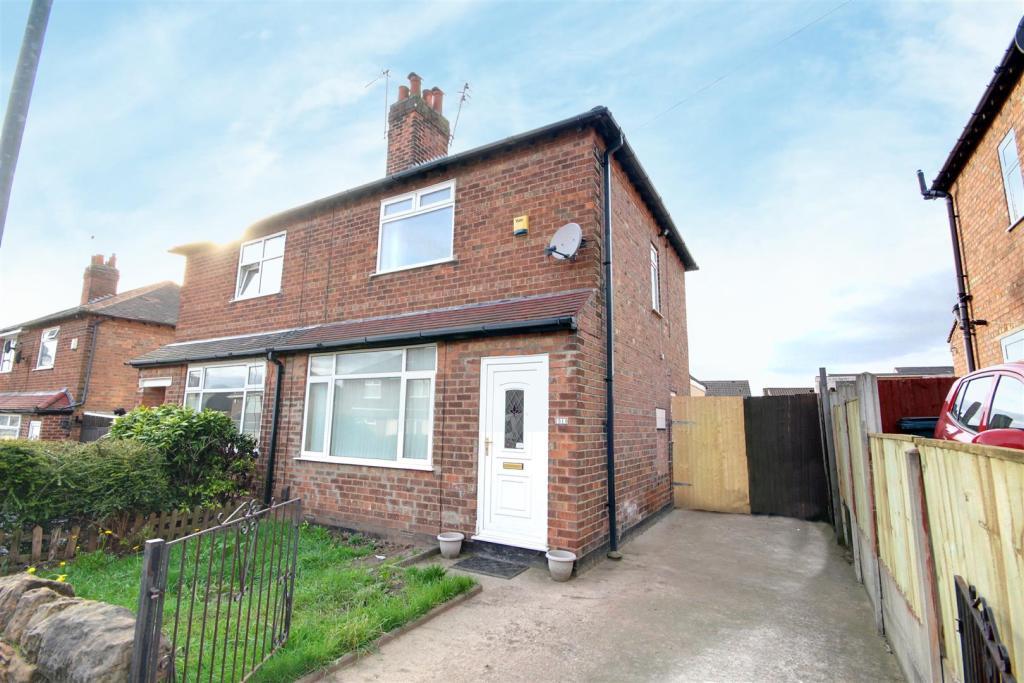
20 Chestnut Grove
NG5 8BD · Semi-D · 3 bed
Was
£29,000 (Oct 2001)
Now
£228,000 (Sep 2025)
Price change
+£199,000 over 24.0 yrs
Total %
686.2%
Annualised %
↑ 9.0%
 No. 2
No. 2
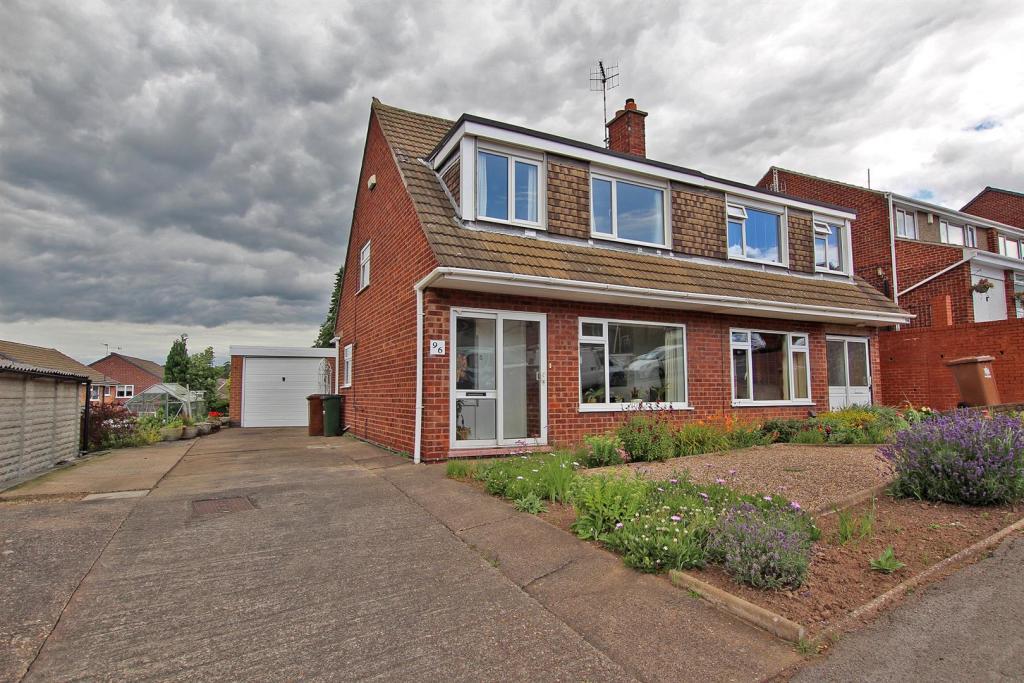
77 Surgeys Lane
NG5 8GD · Semi-D · 3 bed
Was
£100,000 (Jul 2017)
Now
£200,000 (Dec 2025)
Price change
+£100,000 over 8.4 yrs
Total %
100.0%
Annualised %
↑ 8.6%
 No. 3
No. 3
120 Surgeys Lane
NG5 8EY · Semi-D · 3 bed
Was
£31,000 (Feb 1997)
Now
£245,000 (Dec 2025)
Price change
+£214,000 over 28.8 yrs
Total %
690.3%
Annualised %
↑ 7.4%
 No. 4
No. 4
51 Norbett Road
NG5 8EA · Semi-D · 3 bed
Was
£130,000 (Aug 2017)
Now
£228,500 (Aug 2025)
Price change
+£98,500 over 8.0 yrs
Total %
75.8%
Annualised %
↑ 7.3%
 No. 5
No. 5
47 Deer Park Drive
NG5 8SA · Detached · 4 bed
Was
£240,000 (Mar 2021)
Now
£325,000 (Aug 2025)
Price change
+£85,000 over 4.4 yrs
Total %
35.4%
Annualised %
↑ 7.2%
 No. 6
No. 6
49 Kempton Drive
NG5 8EU · Detached · 4 bed
Was
£325,000 (Mar 2019)
Now
£495,000 (Jul 2025)
Price change
+£170,000 over 6.3 yrs
Total %
52.3%
Annualised %
↑ 6.9%
 No. 7
No. 7
113 Birchfield Road
NG5 8BP · Semi-D · 3 bed
Was
£158,000 (Aug 2017)
Now
£265,000 (Oct 2025)
Price change
+£107,000 over 8.2 yrs
Total %
67.7%
Annualised %
↑ 6.5%
 No. 8
No. 8
23 Birchfield Road
NG5 8BJ · Semi-D · 3 bed
Was
£150,000 (Aug 2018)
Now
£240,000 (Feb 2026)
Price change
+£90,000 over 7.5 yrs
Total %
60.0%
Annualised %
↑ 6.5%
 No. 9
No. 9
7 Roscoe Avenue
NG5 8JZ · Semi-D · 3 bed
Was
£52,000 (Jul 2001)
Now
£238,000 (Jan 2026)
Price change
+£186,000 over 24.6 yrs
Total %
357.7%
Annualised %
↑ 6.4%
 No. 10
59 Woodchurch Road
NG5 8NJ · Detached · 4 bed
Was
£350,000 (Jan 2019)
Now
£525,000 (Mar 2026)
Price change
+£175,000 over 7.1 yrs
Total %
50.0%
Annualised %
↑ 5.9%
 No. 11
96 Middlebeck Drive
NG5 8AF · Semi-D · 3 bed
Was
£180,000 (Mar 2021)
Now
£235,000 (Nov 2025)
Price change
+£55,000 over 4.7 yrs
Total %
30.6%
Annualised %
↑ 5.9%
 No. 12
5 Birch Lea
NG5 8LT · Detached · 4 bed
Was
£360,000 (May 2014)
Now
£690,000 (Nov 2025)
Price change
+£330,000 over 11.4 yrs
Total %
91.7%
Annualised %
↑ 5.9%
 No. 13
19 Bestwood Lodge Drive
NG5 8NE · Terrace · 2 bed
Was
£111,000 (Nov 2017)
Now
£175,000 (Nov 2025)
Price change
+£64,000 over 8.0 yrs
Total %
57.7%
Annualised %
↑ 5.8%
 No. 14
34 Kenneth Road
NG5 8HY · Detached · 4 bed
Was
£196,000 (Apr 2015)
Now
£350,000 (Nov 2025)
Price change
+£154,000 over 10.6 yrs
Total %
78.6%
Annualised %
↑ 5.6%
 No. 15
24 Sunninghill Rise
NG5 8ES · Detached · 4 bed
Was
£206,000 (Mar 2016)
Now
£345,000 (Aug 2025)
Price change
+£139,000 over 9.5 yrs
Total %
67.5%
Annualised %
↑ 5.6%
Frequently asked questions
Each entry links sales by the address and property type from Land Registry, with two registered sales at least two years apart.
The latest sale was in the last 12 months. Prices are nominal — not adjusted for extensions, condition, or inflation.
We show listings with archived photos and floorplans where available (15 snakes, 15 ladders).
A fall is not always a market crash story. Land Registry data input errors, Lease or title changes, part ownership, mis-matched addresses can all influence the numbers.
This is not analysis nor is it investment advice, just a bit of fun.
We link sales based on the address and property type provided by Land Registry. We then compare the latest sale to the immediately previous registered sale on that address.