Property Snakes & Ladders in PR8 3

The biggest price drops and jumps on homes sold in the last year, compared with their previous Land Registry sale - curiosity, not analysis.

Rankings from Land Registry resales, last calculated 04 August 2026.

Explore another area

Snakes — biggest house price falls in PR8 3

The top-ranked PR8 3 properties with the largest house price falls on resale. Go beyond house price indices with specific examples.
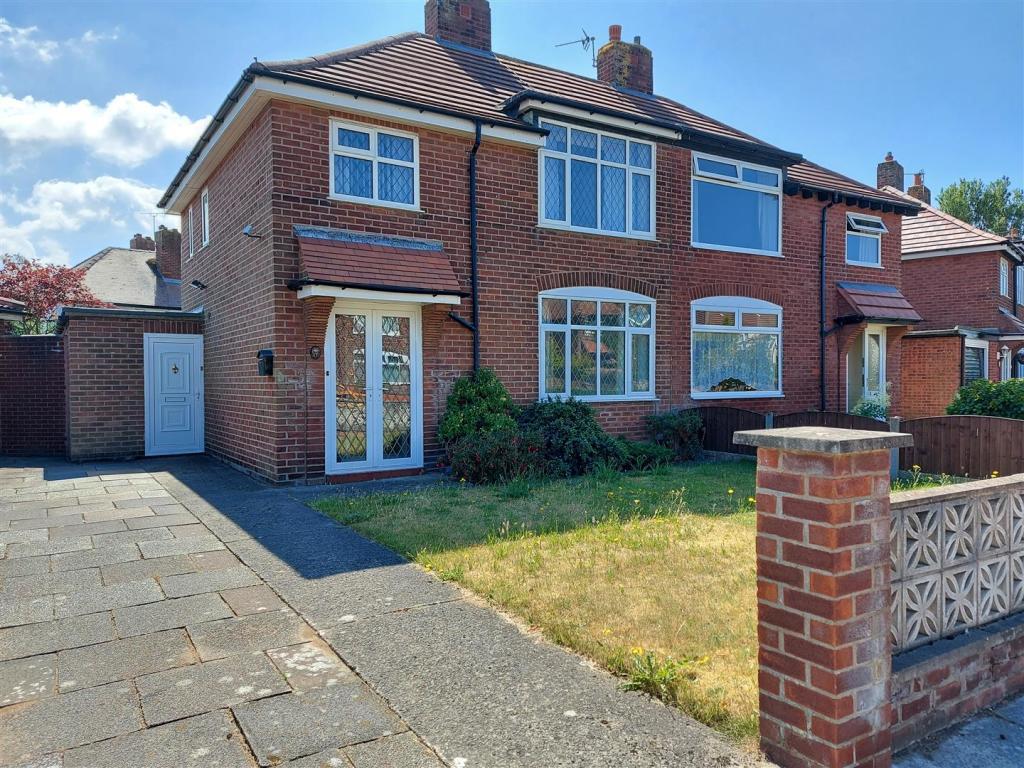
Listing photo for 17 Leybourne Avenue No. 1

17 Leybourne Avenue

PR8 3EL · Semi-D · 3 bed

Was £180,500 (Aug 2021)
Now £176,500 (Mar 2026)
Price change -£4,000 over 4.6 yrs
Total % -2.2%
Annualised % ↓ 0.5%
Listing photo for 25 Briar Road No. 2

25 Briar Road

PR8 3RB · Semi-D · 3 bed

Was £125,000 (Jun 2008)
Now £120,000 (Mar 2026)
Price change -£5,000 over 17.7 yrs
Total % -4.0%
Annualised % ↓ 0.2%

Ladders — largest house price rises in PR8 3

The top-ranked PR8 3 properties with the biggest house price rises on resale. Go beyond house price indices with specific examples.

Listing photo for 90 New Cut Lane No. 1

90 New Cut Lane

PR8 3DJ · Semi-D · 3 bed

Was £100,000 (Aug 2013)
Now £520,000 (Oct 2025)
Price change +£420,000 over 12.2 yrs
Total % 420.0%
Annualised % ↑ 14.5%
Listing photo for 49 Leamington Road No. 2

49 Leamington Road

PR8 3JZ · Semi-D · 3 bed

Was £135,000 (Jun 2018)
Now £355,000 (Jan 2026)
Price change +£220,000 over 7.7 yrs
Total % 163.0%
Annualised % ↑ 13.4%
Listing photo for 92 Waterloo Road No. 3

92 Waterloo Road

PR8 3AY · Detached · 4 bed

Was £650,000 (Jun 2021)
Now £1,052,000 (Aug 2025)
Price change +£402,000 over 4.1 yrs
Total % 61.9%
Annualised % ↑ 12.3%
Listing photo for 93 Heathfield Road No. 4

93 Heathfield Road

PR8 3DY · Semi-D · 3 bed

Was £165,000 (May 2021)
Now £245,000 (Oct 2025)
Price change +£80,000 over 4.4 yrs
Total % 48.5%
Annualised % ↑ 9.4%
Listing photo for 20 Leybourne Avenue No. 5

20 Leybourne Avenue

PR8 3EL · Semi-D · 3 bed
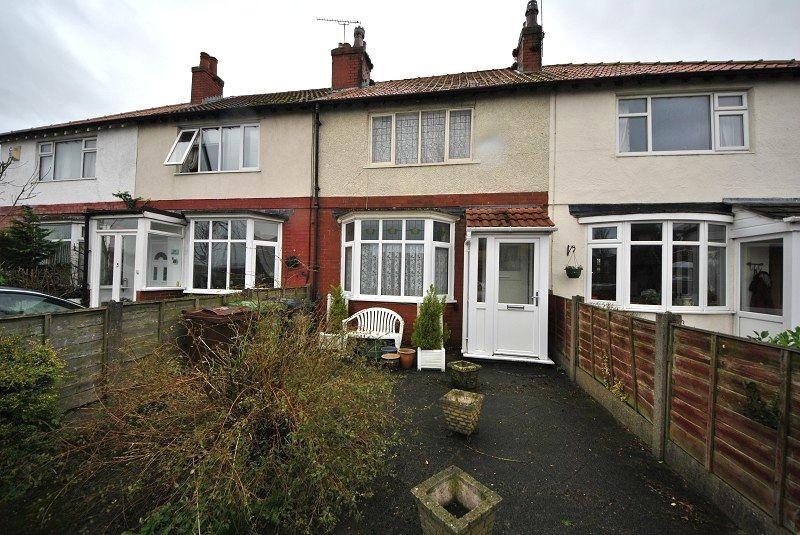
Was £142,950 (Jun 2018)
Now £270,000 (Aug 2025)
Price change +£127,050 over 7.2 yrs
Total % 88.9%
Annualised % ↑ 9.3%
Listing photo for 24 Staveley Road No. 6

24 Staveley Road

PR8 3NN · Terrace · 2 bed

Was £80,000 (Jun 2016)
Now £185,000 (Dec 2025)
Price change +£105,000 over 9.5 yrs
Total % 131.2%
Annualised % ↑ 9.2%
Listing photo for 633 Liverpool Road No. 7

633 Liverpool Road

PR8 3NG · Semi-D · 3 bed

Was £240,000 (Sep 2019)
Now £374,995 (Aug 2025)
Price change +£134,995 over 5.9 yrs
Total % 56.2%
Annualised % ↑ 7.8%
Listing photo for 6 Gleneagles Drive No. 8

6 Gleneagles Drive

PR8 3PP · Terrace · 3 bed

Was £255,000 (Sep 2021)
Now £345,000 (Dec 2025)
Price change +£90,000 over 4.2 yrs
Total % 35.3%
Annualised % ↑ 7.4%
Listing photo for 15 Dorset Avenue No. 9

15 Dorset Avenue

PR8 3SW · Semi-D · 3 bed

Was £172,000 (Jan 2020)
Now £261,250 (Apr 2026)
Price change +£89,250 over 6.2 yrs
Total % 51.9%
Annualised % ↑ 7.0%
Listing photo for 41 Berwick Avenue No. 10

41 Berwick Avenue

PR8 3LJ · Semi-D · 3 bed

Was £161,500 (Nov 2021)
Now £205,000 (Aug 2025)
Price change +£43,500 over 3.7 yrs
Total % 26.9%
Annualised % ↑ 6.6%
Listing photo for 3 Hillsview Road No. 11

3 Hillsview Road

PR8 3PW · Detached · 3 bed

Was £252,000 (Aug 2018)
Now £390,000 (Aug 2025)
Price change +£138,000 over 7.0 yrs
Total % 54.8%
Annualised % ↑ 6.4%
Listing photo for 22 Dunster Road No. 12

22 Dunster Road

PR8 3AQ · Detached · 4 bed

Was £273,500 (Aug 2014)
Now £525,500 (Aug 2025)
Price change +£252,000 over 11.0 yrs
Total % 92.1%
Annualised % ↑ 6.1%
Listing photo for 17 Hillsview Road No. 13

17 Hillsview Road

PR8 3PW · Detached · 4 bed
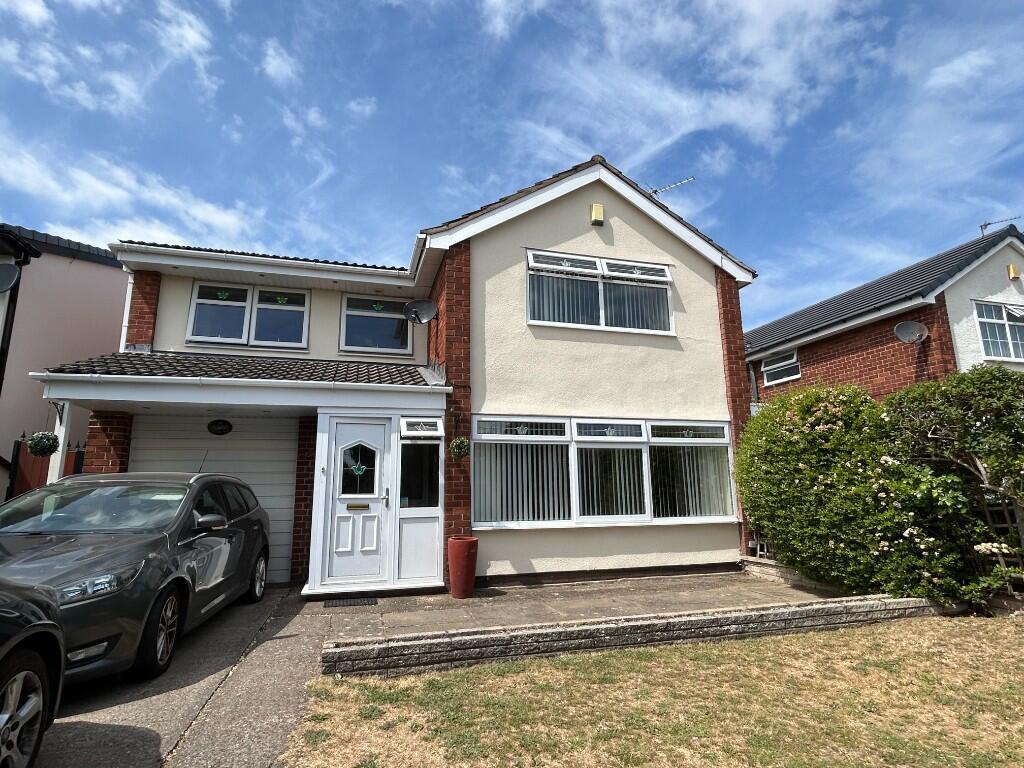
Was £111,000 (Apr 2000)
Now £500,000 (Mar 2026)
Price change +£389,000 over 25.9 yrs
Total % 350.5%
Annualised % ↑ 6.0%
Listing photo for 16 Kendal Way No. 14

16 Kendal Way

PR8 3TU · Detached · 4 bed

Was £59,950 (May 1995)
Now £350,000 (Dec 2025)
Price change +£290,050 over 30.5 yrs
Total % 483.8%
Annualised % ↑ 5.9%
Listing photo for 59 Pinfold Lane No. 15

59 Pinfold Lane

PR8 3QL · Semi-D · 4 bed

Was £208,000 (Jul 2018)
Now £320,000 (Mar 2026)
Price change +£112,000 over 7.7 yrs
Total % 53.8%
Annualised % ↑ 5.8%

Frequently asked questions

Each entry links sales by the address and property type from Land Registry, with two registered sales at least two years apart. The latest sale was in the last 12 months. Prices are nominal — not adjusted for extensions, condition, or inflation. We show listings with archived photos and floorplans where available (15 snakes, 15 ladders).

A fall is not always a market crash story. Land Registry data input errors, Lease or title changes, part ownership, mis-matched addresses can all influence the numbers. This is not analysis nor is it investment advice, just a bit of fun.

We link sales based on the address and property type provided by Land Registry. We then compare the latest sale to the immediately previous registered sale on that address.

Back to PR8 3 house price analysis