Property Snakes & Ladders in SN6 7

The biggest price drops and jumps on homes sold in the last year, compared with their previous Land Registry sale - curiosity, not analysis.

Rankings from Land Registry resales, last calculated 05 June 2026.

Explore another area

Snakes — biggest house price falls in SN6 7

The top-ranked SN6 7 properties with the largest house price falls on resale. Go beyond house price indices with specific examples.
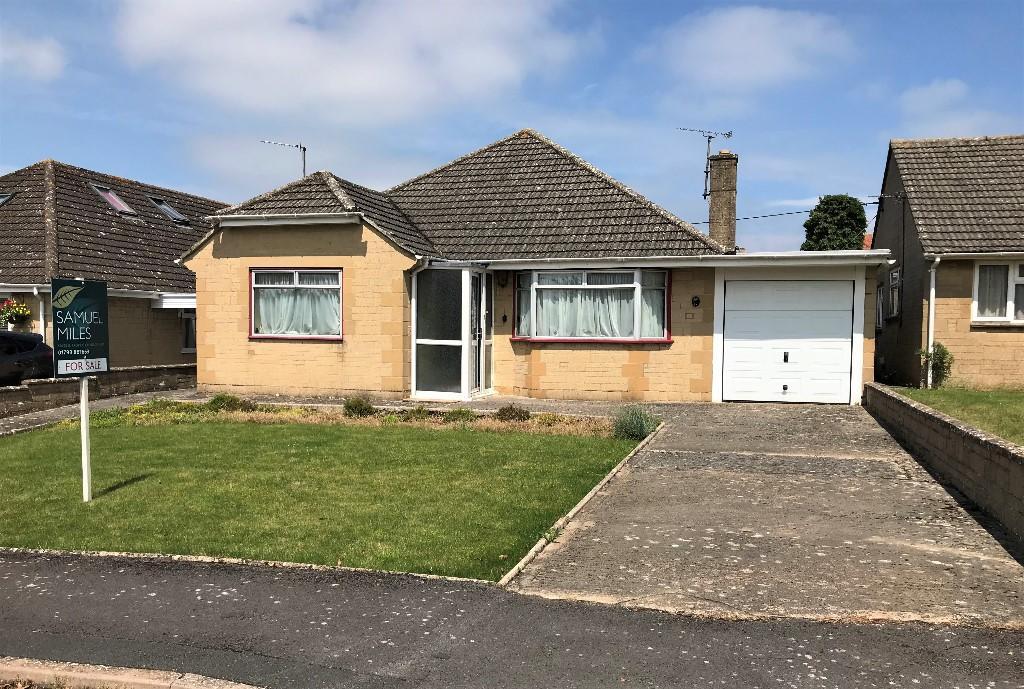
Listing photo for 83 Sevenfields No. 1

83 Sevenfields

SN6 7NG · Detached · 3 bed

Was £340,000 (Jul 2022)
Now £335,000 (Jul 2025)
Price change -£5,000 over 3.0 yrs
Total % -1.5%
Annualised % ↓ 0.5%

Ladders — largest house price rises in SN6 7

The top-ranked SN6 7 properties with the biggest house price rises on resale. Go beyond house price indices with specific examples.

Listing photo for 19 Wrde Hill No. 1

19 Wrde Hill

SN6 7BX · Detached · 3 bed

Was £420,000 (Nov 2023)
Now £525,000 (Nov 2025)
Price change +£105,000 over 2.1 yrs
Total % 25.0%
Annualised % ↑ 11.5%
Listing photo for 9 Folly Close No. 2

9 Folly Close

SN6 7JP · Semi-D · 3 bed

Was £217,000 (Sep 2020)
Now £359,000 (Oct 2025)
Price change +£142,000 over 5.1 yrs
Total % 65.4%
Annualised % ↑ 10.4%
Listing photo for 10 Wrde Hill No. 3

10 Wrde Hill

SN6 7BX · Detached · 3 bed

Was £300,000 (Dec 2018)
Now £515,000 (Aug 2025)
Price change +£215,000 over 6.7 yrs
Total % 71.7%
Annualised % ↑ 8.4%
Listing photo for 1 Cricklade Road No. 4

1 Cricklade Road

SN6 7BW · Detached · 4 bed

Was £200,000 (Sep 2021)
Now £260,000 (Mar 2026)
Price change +£60,000 over 4.5 yrs
Total % 30.0%
Annualised % ↑ 6.0%
Listing photo for 2 Eastrop No. 5

2 Eastrop

SN6 7AP · Terrace · 3 bed

Was £422,750 (Mar 2021)
Now £540,000 (Jul 2025)
Price change +£117,250 over 4.4 yrs
Total % 27.7%
Annualised % ↑ 5.8%
Listing photo for 98 Knowlands No. 6

98 Knowlands

SN6 7ND · Terrace · 2 bed

Was £163,000 (Oct 2020)
Now £220,000 (Feb 2026)
Price change +£57,000 over 5.3 yrs
Total % 35.0%
Annualised % ↑ 5.8%
Listing photo for 4 Edencroft No. 7

4 Edencroft

SN6 7NJ · Flat · 2 bed

Was £125,000 (Apr 2021)
Now £157,000 (Jul 2025)
Price change +£32,000 over 4.2 yrs
Total % 25.6%
Annualised % ↑ 5.5%
Listing photo for Ground Floor Flat 33 Swindon Street No. 8

Ground Floor Flat 33 Swindon Street

SN6 7AH · Flat · 1 bed

Was £127,500 (Aug 2022)
Now £149,950 (Aug 2025)
Price change +£22,450 over 3.1 yrs
Total % 17.6%
Annualised % ↑ 5.5%
Listing photo for 13 Wrde Hill No. 9

13 Wrde Hill

SN6 7BX · Detached · 3 bed

Was £126,000 (Jul 1999)
Now £485,000 (Dec 2025)
Price change +£359,000 over 26.4 yrs
Total % 284.9%
Annualised % ↑ 5.2%
Listing photo for 2 Eastview Terrace No. 10

2 Eastview Terrace

SN6 7HH · Semi-D · 3 bed

Was £295,000 (Sep 2020)
Now £375,000 (Jun 2025)
Price change +£80,000 over 4.7 yrs
Total % 27.1%
Annualised % ↑ 5.2%
Listing photo for 40 Windrush No. 11

40 Windrush

SN6 7DT · Terrace · 3 bed

Was £54,995 (May 1998)
Now £210,000 (Jul 2025)
Price change +£155,005 over 27.1 yrs
Total % 281.8%
Annualised % ↑ 5.1%
Listing photo for 361 Windrush No. 12

361 Windrush

SN6 7EF · Terrace · 3 bed

Was £185,000 (Oct 2016)
Now £285,000 (Jul 2025)
Price change +£100,000 over 8.8 yrs
Total % 54.0%
Annualised % ↑ 5.1%
Listing photo for 9 Stroma Way No. 13

9 Stroma Way

SN6 7HT · Semi-D · 3 bed

Was £310,000 (Oct 2020)
Now £389,950 (Aug 2025)
Price change +£79,950 over 4.9 yrs
Total % 25.8%
Annualised % ↑ 4.8%
Listing photo for 29 Cherry Orchard No. 14

29 Cherry Orchard

SN6 7AU · Terrace · 3 bed

Was £178,000 (Jun 2014)
Now £295,000 (Aug 2025)
Price change +£117,000 over 11.2 yrs
Total % 65.7%
Annualised % ↑ 4.6%
Listing photo for 48 Cricklade Road No. 15

48 Cricklade Road

SN6 7BL · Semi-D · 3 bed

Was £122,500 (Mar 2000)
Now £380,000 (Dec 2025)
Price change +£257,500 over 25.7 yrs
Total % 210.2%
Annualised % ↑ 4.5%

Frequently asked questions

Each entry links sales by the address and property type from Land Registry, with two registered sales at least two years apart. The latest sale was in the last 12 months. Prices are nominal — not adjusted for extensions, condition, or inflation. We show listings with archived photos and floorplans where available (15 snakes, 15 ladders).

A fall is not always a market crash story. Land Registry data input errors, Lease or title changes, part ownership, mis-matched addresses can all influence the numbers. This is not analysis nor is it investment advice, just a bit of fun.

We link sales based on the address and property type provided by Land Registry. We then compare the latest sale to the immediately previous registered sale on that address.

Back to SN6 7 house price analysis