Property Snakes & Ladders in UB7 0
The biggest price drops and jumps on homes sold in the last year, compared with their previous Land Registry sale - curiosity, not analysis.
Rankings from Land Registry resales, last calculated 01 July 2026.
Ladders — largest house price rises in UB7 0
The top-ranked UB7 0 properties with the biggest house price rises on resale. Go beyond house price indices with specific examples.
 No. 1
No. 1
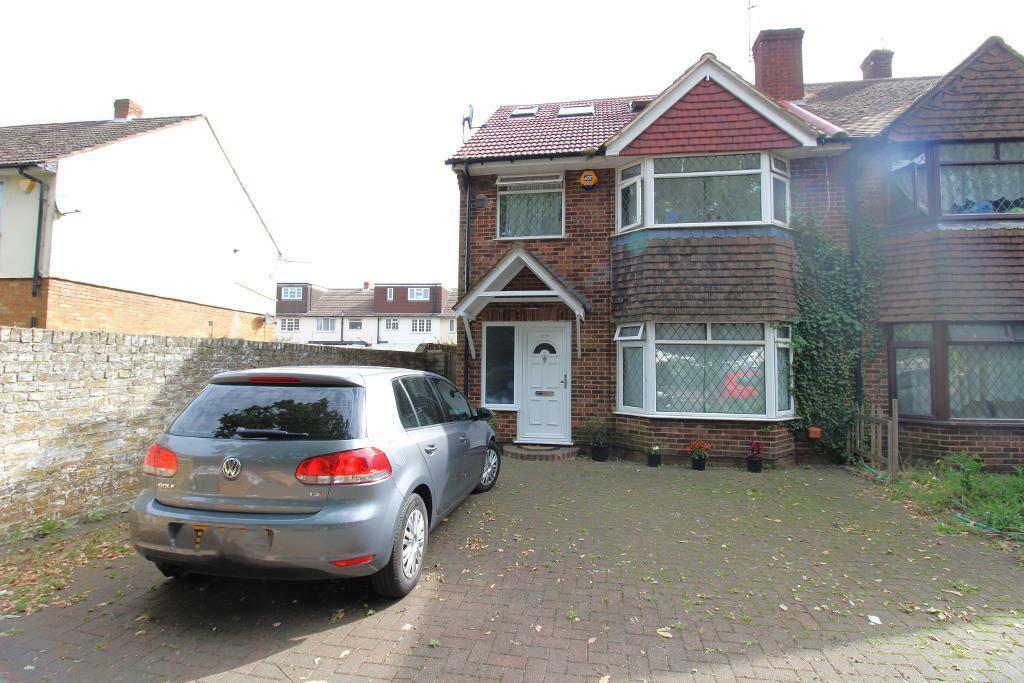
379 Sipson Road
UB7 0HU · Semi-D · 3 bed
Was
£250,000 (Dec 2006)
Now
£520,000 (Sep 2025)
Price change
+£270,000 over 18.8 yrs
Total %
108.0%
Annualised %
↑ 4.0%
 No. 2
No. 2
42 Russell Gardens
UB7 0LS · Semi-D · 1 bed
Was
£131,000 (Jan 2004)
Now
£275,000 (Jul 2025)
Price change
+£144,000 over 21.5 yrs
Total %
109.9%
Annualised %
↑ 3.5%
 No. 3
No. 3
3 Bomer Close
UB7 0JP · Semi-D · 3 bed
Was
£467,950 (Apr 2022)
Now
£487,000 (Sep 2025)
Price change
+£19,050 over 3.4 yrs
Total %
4.1%
Annualised %
↑ 1.2%
Frequently asked questions
Each entry links sales by the address and property type from Land Registry, with two registered sales at least two years apart.
The latest sale was in the last 12 months. Prices are nominal — not adjusted for extensions, condition, or inflation.
We show listings with archived photos and floorplans where available (15 snakes, 15 ladders).
A fall is not always a market crash story. Land Registry data input errors, Lease or title changes, part ownership, mis-matched addresses can all influence the numbers.
This is not analysis nor is it investment advice, just a bit of fun.
We link sales based on the address and property type provided by Land Registry. We then compare the latest sale to the immediately previous registered sale on that address.