Custom charts show how price per square metre is spread across a set of sales you choose. Use them when a single average is not enough and you want to see the middle of the market, the spread, and whether flats, houses or new builds sit apart from one another.
The charts are part of a premium subscription. Open them from Analysis, or go straight to Custom charts.
What the chart measures
Every chart is price per square metre, not the price paid for the whole property. A large house and a small flat can have similar prices per square metre and very different sale prices. Read the chart as a comparison of rate, then look at the sale price separately if that is the question.
HouseMetric can chart a sale only when it has a usable floor area from an Energy Performance Certificate. Other sales in the area still exist. The results say how many sales matched the search, and how many of those are missing a usable price per square metre.
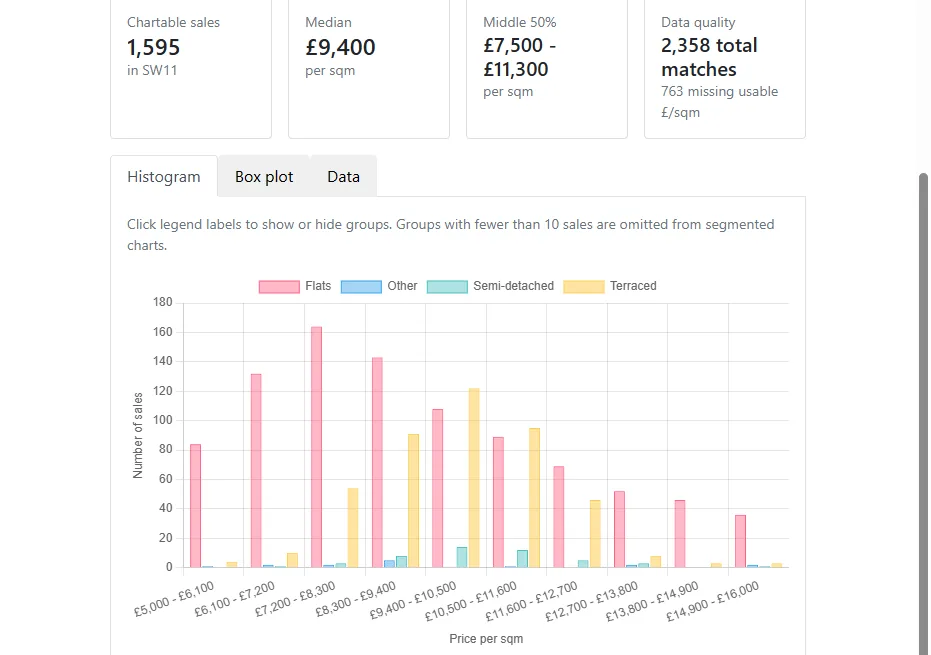
The summary above the chart reports:
- chartable sales, which are the sales drawn on the chart;
- the median price per square metre;
- the middle 50%, from the lower quartile to the upper quartile.
Use the ft² / m² switch above the results to show the same figures per square foot. The size filters on the form stay in square metres either way.
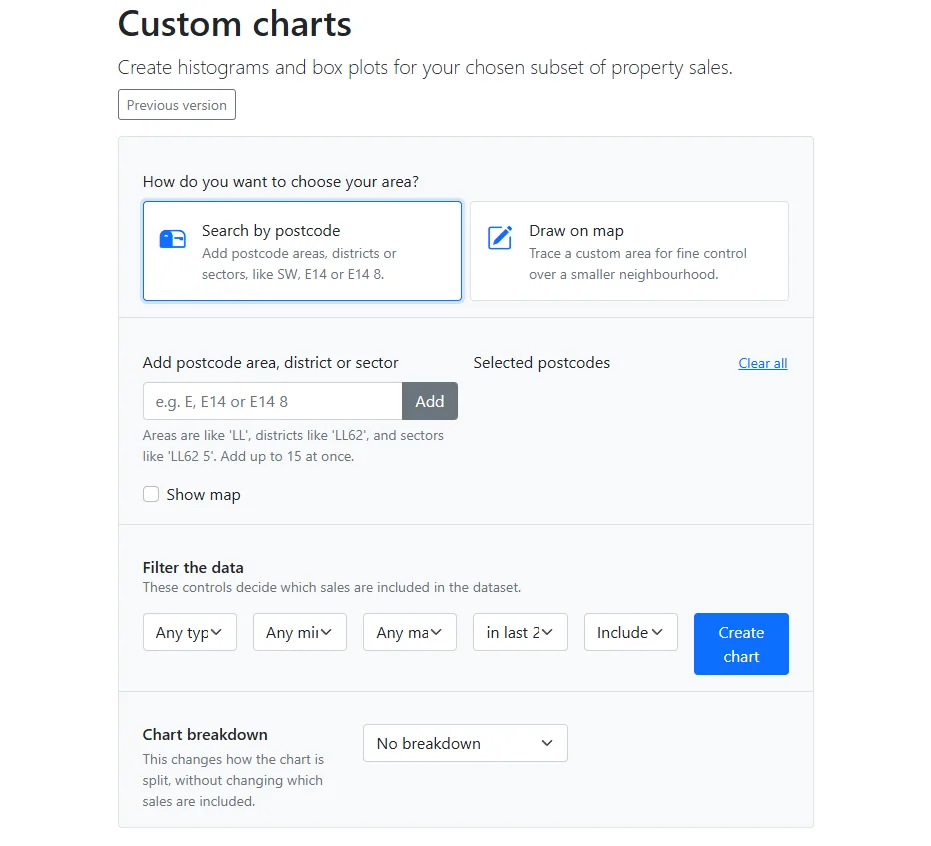
Choose the area
Start by deciding how to set the boundary. There are two choices.
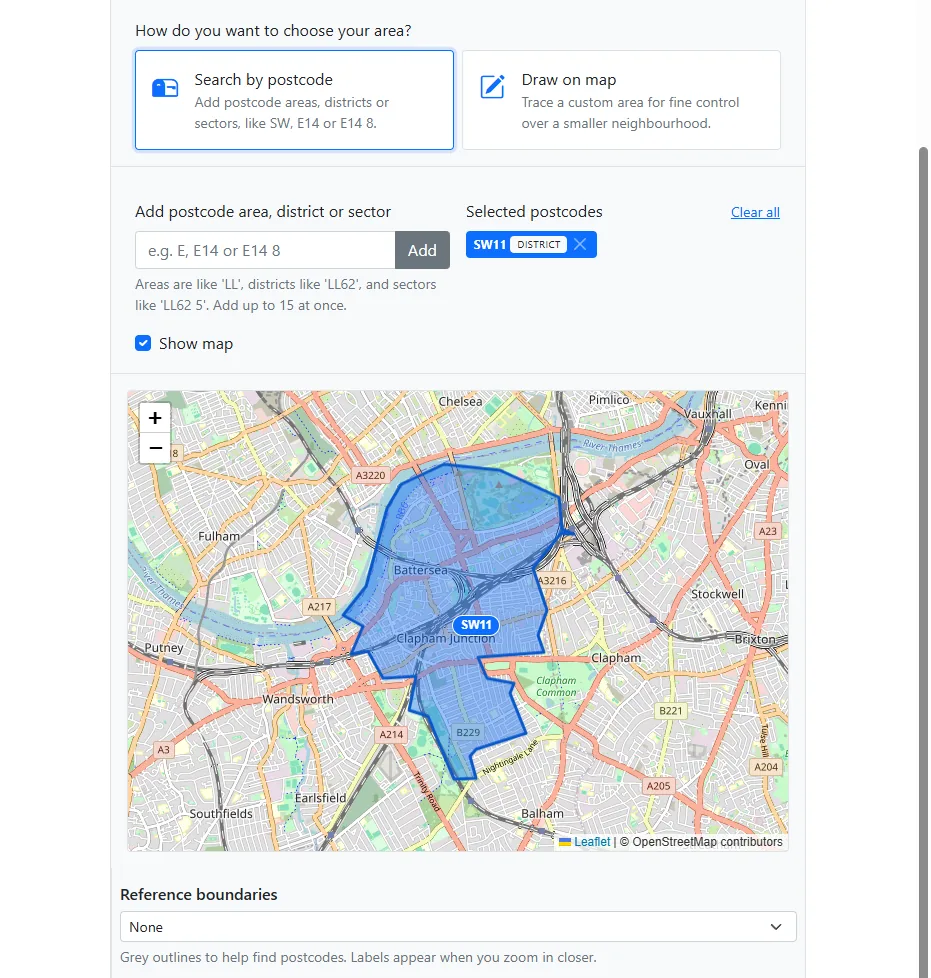
Search by postcode. Add a postcode area, district or sector, then press Add. An area looks like SW, a district like E14, and a sector like E14 8. You can mix them, up to 15 at once. Selected postcodes can be removed one by one, or cleared together.
Turn on Show map if you want to see the selected postcodes highlighted. Reference boundaries draw grey outlines for areas, districts or sectors so you can find the right code. Labels appear when you zoom in.
Draw on map. Hold and drag to trace a neighbourhood. This is the better choice when a postcode is too coarse, for example when you want one estate rather than a whole district. The drawn area can be up to 300 km². For anything larger, such as a whole postcode area, switch back to postcodes. If the shape will not run, clear it and draw a simpler outline.
Current value, price per square metre and social housing can be shown on the map while you choose the area. Those layers do not change which sales go into the chart.
Filter the sales
The filters under the map decide which sales are included. The date starts at the last two years. Change it if you need a shorter or longer period: the choices run from the last three months to the last six years.
You can also limit:
- property type, such as flats only, all houses, detached, semi-detached, terraced, or terrace and semi-detached together;
- minimum and maximum floor area, in square metres;
- new builds, which can be included, kept on their own, or excluded.
Leave a filter open when it is not part of the question. A tight combination of a small area, a short period and a narrow property type can leave too few sales to chart.
Split the chart, or leave it as one group
The breakdown changes how the chart is split. It does not add or remove sales.
- No breakdown shows every included sale as one group.
- Property type separates flats, terraced, semi-detached, detached and other.
- New build status separates new homes from existing ones.
- Property type and new build together splits by both.
A group with fewer than 10 sales is left off a split chart. If an important group disappears, choose No breakdown or widen the search until that group is large enough to stand on its own.
Read the histogram and the box plot
The chart needs at least 10 sales with a usable price per square metre. More than 60,000 is too many for this tool. Narrow the area, shorten the period, or add a filter. For a whole town, city or county, use the pre-calculated local analysis pages instead.
The histogram splits the middle of the distribution into ten bands, from the 5th percentile to the 95th. Very low and very high sales still count towards the median and the middle 50%, but they sit outside those bars. Where the chart is split, select a legend label to show or hide a group.
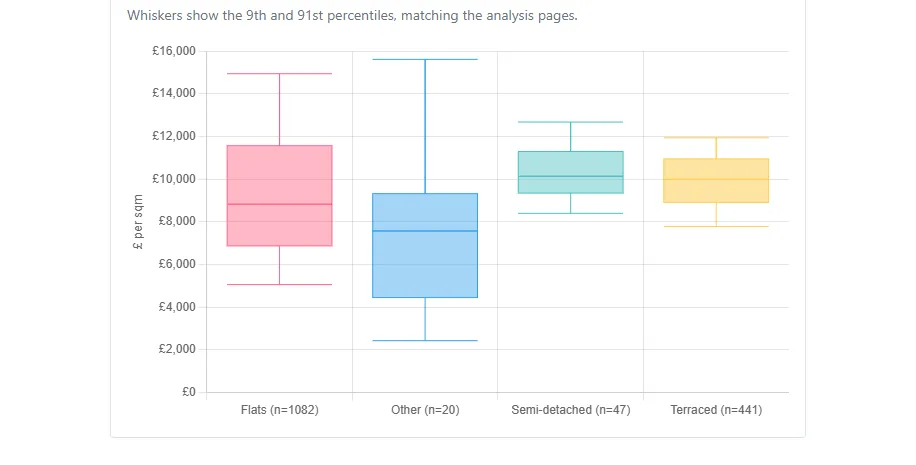
The two pictures below are one example: postcode district SW11, any property type, sales in the last two years, broken down by property type. They show that search as it stood when this article was published. Run the chart again for the current figures.
The box plot is the quicker summary of the same sales. The box is the middle 50%. The line inside it is the median. The whiskers reach the 9th and 91st percentiles, which is the same convention as the analysis pages.
Download the sales
Open the Data tab to download the sales behind the chart as a CSV. The file includes the address, sale date, price paid, floor area, price per square metre, property type and whether the sale was a new build.
The download is available when there are 10,000 chartable sales or fewer. Between that and 60,000 you can still view the chart, but not download the rows. Narrow the search if you need the file.
If the chart will not run
- Too few sales: widen the area, lengthen the period, or remove a filter. The message tells you how many sales matched.
- Too many sales: do the opposite, or use local analysis for the larger geography.
- The search takes too long: use a smaller area, a shorter period, or add a property type or size filter.
- A split chart is empty: one or more groups have fewer than 10 sales. Choose No breakdown, or broaden the search.
- A drawn area fails: clear it and draw again. If it is larger than 300 km², use postcodes instead.
A useful final check
Before treating the chart as evidence, ask:
- Is the boundary the market I meant, rather than a convenient postcode?
- Have I kept property type, size and new-build status consistent with the question?
- Is the period long enough to fill out the middle of the distribution, and recent enough to describe the current market?
- Are any groups missing because they had fewer than 10 sales?
The chart describes the sales that matched. It does not adjust for condition, plot, lease length or a recent extension, and an EPC floor area can itself be wrong. Use the chart to see the spread, then inspect individual sales when a bar or a whisker needs explaining.