Property Snakes & Ladders in CW

The biggest price drops and jumps on homes sold in the last year, compared with their previous Land Registry sale - curiosity, not analysis.

Rankings from Land Registry resales, last calculated 05 June 2026.

Explore another area

Snakes — biggest house price falls in CW

The top-ranked CW properties with the largest house price falls on resale. Go beyond house price indices with specific examples.

Listing photo for Flat 4 Empire Mill Hall O'shaw Street No. 1

Flat 4 Empire Mill Hall O'shaw Street

CW1 4AE · Flat · 1 bed

Was £60,000 (Aug 2022)
Now £46,000 (Aug 2025)
Price change -£14,000 over 3.0 yrs
Total % -23.3%
Annualised % ↓ 8.4%
Listing photo for 2 Lambert Way No. 2

2 Lambert Way

CW8 1RR · Semi-D · 3 bed

Was £311,000 (Sep 2022)
Now £240,000 (Dec 2025)
Price change -£71,000 over 3.2 yrs
Total % -22.8%
Annualised % ↓ 7.8%
Listing photo for 27 Grove Avenue No. 3

27 Grove Avenue

CW7 1TP · Detached

Was £209,995 (Jun 2019)
Now £121,400 (Mar 2026)
Price change -£88,595 over 6.8 yrs
Total % -42.2%
Annualised % ↓ 7.7%
Listing photo for 2 Holly Bank Cottage Twemlow Lane No. 4

2 Holly Bank Cottage Twemlow Lane

CW4 8EX · Detached · 3 bed

Was £345,000 (Feb 2019)
Now £217,500 (Jun 2025)
Price change -£127,500 over 6.4 yrs
Total % -37.0%
Annualised % ↓ 7.0%
Listing photo for 33 Somerville Street No. 5

33 Somerville Street

CW2 7NP · Terrace · 2 bed

Was £100,000 (Feb 2017)
Now £55,000 (Sep 2025)
Price change -£45,000 over 8.6 yrs
Total % -45.0%
Annualised % ↓ 6.7%
Listing photo for 12 Sparrow Close No. 6

12 Sparrow Close

CW5 5XW · Detached

Was £435,000 (Sep 2023)
Now £380,000 (Sep 2025)
Price change -£55,000 over 2.0 yrs
Total % -12.6%
Annualised % ↓ 6.4%
Listing photo for 38 Wright Court No. 7

38 Wright Court

CW5 6SE · Flat · 1 bed

Was £92,000 (Aug 2022)
Now £75,000 (Oct 2025)
Price change -£17,000 over 3.2 yrs
Total % -18.5%
Annualised % ↓ 6.2%
Listing photo for 2 Tilstone Close No. 8

2 Tilstone Close

CW2 5RQ · Detached · 2 bed

Was £315,000 (Sep 2021)
Now £252,000 (Jun 2025)
Price change -£63,000 over 3.7 yrs
Total % -20.0%
Annualised % ↓ 5.8%
Listing photo for 44 Marbury Court Chester Way No. 9

44 Marbury Court Chester Way

CW9 5FQ · Flat

Was £325,000 (Jun 2023)
Now £285,000 (Sep 2025)
Price change -£40,000 over 2.3 yrs
Total % -12.3%
Annualised % ↓ 5.7%
Listing photo for Bwthyn Clyd Alsager Road No. 10

Bwthyn Clyd Alsager Road

CW11 4YB · Detached

Was £675,000 (Sep 2022)
Now £580,000 (Jul 2025)
Price change -£95,000 over 2.8 yrs
Total % -14.1%
Annualised % ↓ 5.4%
Listing photo for 18 Richmond Village No. 11

18 Richmond Village

CW5 6TD · Flat

Was £225,000 (Sep 2023)
Now £200,000 (Dec 2025)
Price change -£25,000 over 2.3 yrs
Total % -11.1%
Annualised % ↓ 5.1%
Listing photo for 65 Romanes Street No. 12

65 Romanes Street

CW8 1DE · Terrace · 2 bed

Was £121,000 (Sep 2019)
Now £90,000 (Sep 2025)
Price change -£31,000 over 6.0 yrs
Total % -25.6%
Annualised % ↓ 4.8%
Listing photo for 7 Moat House Marine Approach No. 13

7 Moat House Marine Approach

CW8 1GE · Flat · 2 bed

Was £163,000 (Aug 2022)
Now £142,500 (Sep 2025)
Price change -£20,500 over 3.1 yrs
Total % -12.6%
Annualised % ↓ 4.3%
Listing photo for 22 Richmond Village No. 14

22 Richmond Village

CW5 6TD · Flat

Was £180,000 (Aug 2021)
Now £150,000 (Nov 2025)
Price change -£30,000 over 4.3 yrs
Total % -16.7%
Annualised % ↓ 4.2%
Listing photo for 11 Gibson Close No. 15

11 Gibson Close

CW5 5UN · Flat · 1 bed

Was £115,000 (Jul 2022)
Now £102,000 (Aug 2025)
Price change -£13,000 over 3.1 yrs
Total % -11.3%
Annualised % ↓ 3.8%

Ladders — largest house price rises in CW

The top-ranked CW properties with the biggest house price rises on resale. Go beyond house price indices with specific examples.

Listing photo for Lower Ridge Batherton Lane No. 1

Lower Ridge Batherton Lane

CW5 7QH · Terrace

Was £115,953 (Nov 2018)
Now £1,117,000 (Aug 2025)
Price change +£1,001,047 over 6.7 yrs
Total % 863.3%
Annualised % ↑ 40.0%
Listing photo for 1 Gibbon Drive No. 2

1 Gibbon Drive

CW9 7QE · Semi-D · 2 bed

Was £150,000 (Mar 2024)
Now £285,000 (Apr 2026)
Price change +£135,000 over 2.1 yrs
Total % 90.0%
Annualised % ↑ 36.4%
Listing photo for 17 Pavillion Way No. 3

17 Pavillion Way

CW9 7YE · Terrace

Was £55,949 (Jan 2020)
Now £225,000 (Jul 2025)
Price change +£169,051 over 5.5 yrs
Total % 302.2%
Annualised % ↑ 29.0%
Listing photo for 2 Beech Grove No. 4

2 Beech Grove

CW11 4JW · Semi-D · 3 bed

Was £165,000 (Jun 2023)
Now £275,000 (Jul 2025)
Price change +£110,000 over 2.1 yrs
Total % 66.7%
Annualised % ↑ 27.7%
Listing photo for 17 Victoria Street No. 5

17 Victoria Street

CW11 1HB · Semi-D · 2 bed
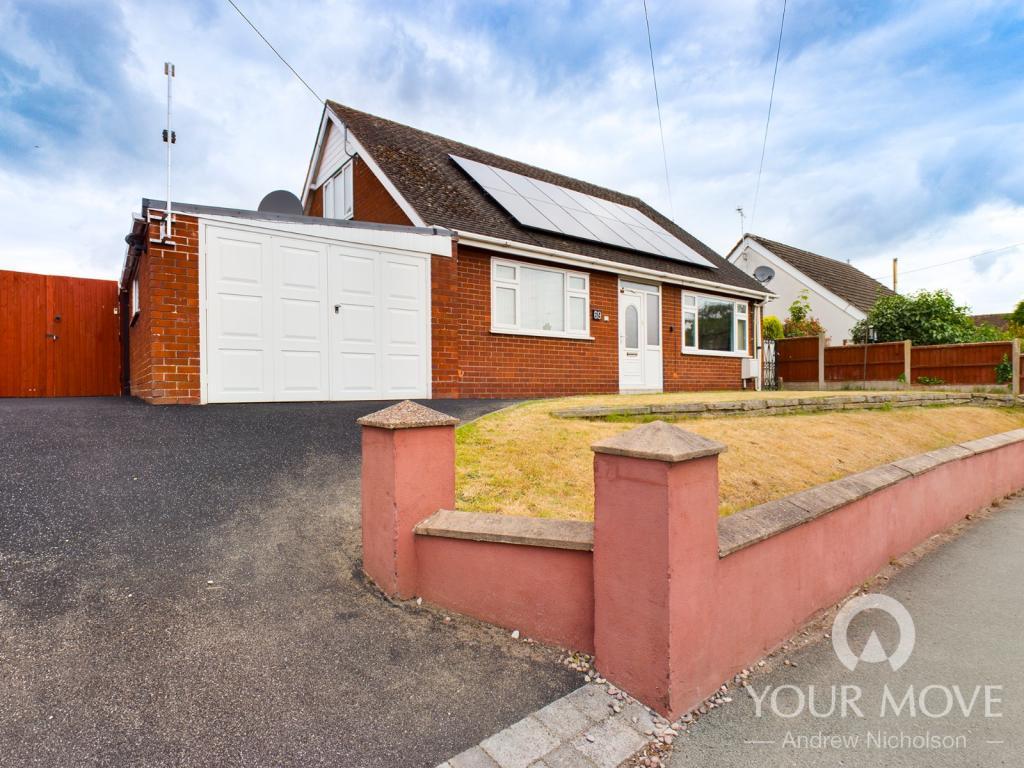
Was £120,000 (Sep 2021)
Now £321,000 (Oct 2025)
Price change +£201,000 over 4.1 yrs
Total % 167.5%
Annualised % ↑ 27.5%
Listing photo for 69 Church Lane No. 6

69 Church Lane

CW2 8EZ · Detached · 2 bed

Was £215,000 (Jul 2023)
Now £375,000 (Dec 2025)
Price change +£160,000 over 2.4 yrs
Total % 74.4%
Annualised % ↑ 25.5%
Listing photo for 27 James Street No. 7

27 James Street

CW9 7DE · Terrace

Was £88,500 (Oct 2021)
Now £190,000 (Jan 2026)
Price change +£101,500 over 4.3 yrs
Total % 114.7%
Annualised % ↑ 19.6%
Listing photo for 8 Nantwich Road No. 8

8 Nantwich Road

CW10 9HE · Semi-D · 2 bed

Was £85,000 (Apr 2022)
Now £160,000 (Nov 2025)
Price change +£75,000 over 3.5 yrs
Total % 88.2%
Annualised % ↑ 19.6%
Listing photo for 39 Hind Heath Road No. 9

39 Hind Heath Road

CW11 3LG · Semi-D · 2 bed

Was £152,000 (Jan 2020)
Now £410,000 (Aug 2025)
Price change +£258,000 over 5.6 yrs
Total % 169.7%
Annualised % ↑ 19.5%
Listing photo for 40 Hawthorne Drive No. 10

40 Hawthorne Drive

CW11 4JH · Detached

Was £295,000 (Sep 2021)
Now £635,000 (Feb 2026)
Price change +£340,000 over 4.5 yrs
Total % 115.3%
Annualised % ↑ 18.7%
Listing photo for 18 Meakin Close No. 11

18 Meakin Close

CW12 3TG · Detached · 4 bed

Was £410,000 (Jul 2023)
Now £612,500 (Nov 2025)
Price change +£202,500 over 2.4 yrs
Total % 49.4%
Annualised % ↑ 18.4%
Listing photo for 1 Lower Heath Terrace No. 12

1 Lower Heath Terrace

CW12 2HL · Terrace

Was £155,000 (Sep 2022)
Now £270,000 (Jan 2026)
Price change +£115,000 over 3.3 yrs
Total % 74.2%
Annualised % ↑ 18.1%
Listing photo for 268 Middlewich Street No. 13

268 Middlewich Street

CW1 4DP · Semi-D · 3 bed

Was £117,000 (Mar 2021)
Now £220,000 (Jun 2025)
Price change +£103,000 over 4.2 yrs
Total % 88.0%
Annualised % ↑ 16.2%
Listing photo for 56 Holland Street No. 14

56 Holland Street

CW1 3TT · Terrace · 2 bed

Was £72,000 (Nov 2020)
Now £147,000 (Oct 2025)
Price change +£75,000 over 4.9 yrs
Total % 104.2%
Annualised % ↑ 15.6%
Listing photo for 27 Manor Way No. 15

27 Manor Way

CW2 6JY · Semi-D · 3 bed

Was £124,000 (Aug 2022)
Now £195,000 (Sep 2025)
Price change +£71,000 over 3.1 yrs
Total % 57.3%
Annualised % ↑ 15.5%

Frequently asked questions

Each entry links sales by the address and property type from Land Registry, with two registered sales at least two years apart. The latest sale was in the last 12 months. Prices are nominal — not adjusted for extensions, condition, or inflation. We show listings with archived photos and floorplans where available (15 snakes, 15 ladders).

A fall is not always a market crash story. Land Registry data input errors, Lease or title changes, part ownership, mis-matched addresses can all influence the numbers. This is not analysis nor is it investment advice, just a bit of fun.

We link sales based on the address and property type provided by Land Registry. We then compare the latest sale to the immediately previous registered sale on that address.

Back to CW house price analysis