Property Snakes & Ladders in HU

The biggest price drops and jumps on homes sold in the last year, compared with their previous Land Registry sale - curiosity, not analysis.

Rankings from Land Registry resales, last calculated 05 June 2026.

Explore another area

Snakes — biggest house price falls in HU

The top-ranked HU properties with the largest house price falls on resale. Go beyond house price indices with specific examples.
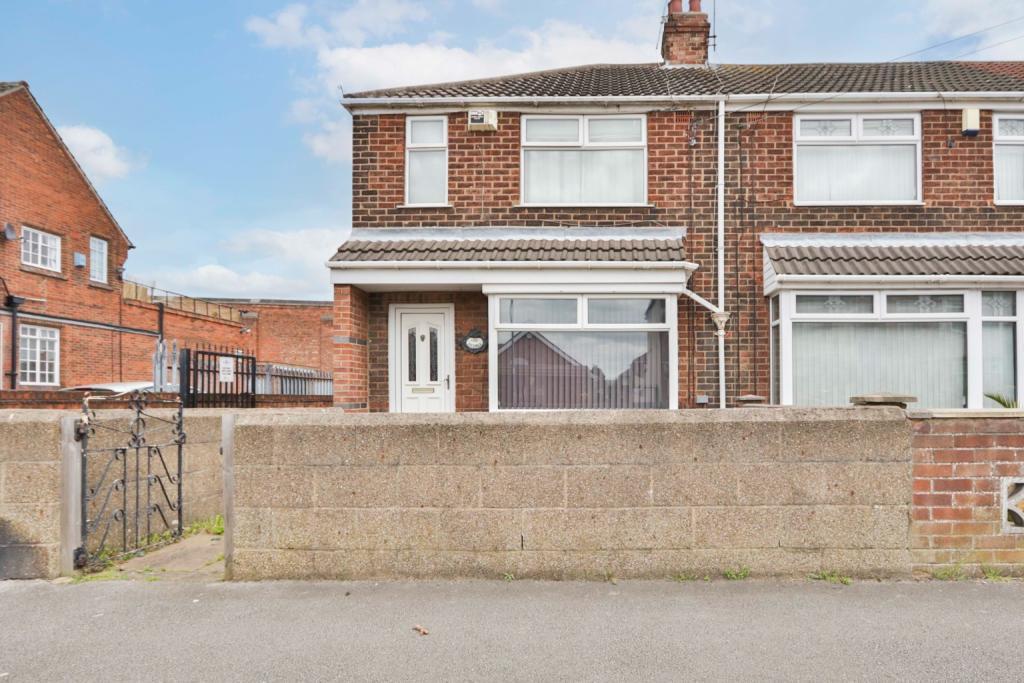
Listing photo for 1 Aston Road No. 1

1 Aston Road

HU10 6SD · Terrace

Was £115,000 (Oct 2022)
Now £64,588 (Nov 2025)
Price change -£50,412 over 3.1 yrs
Total % -43.8%
Annualised % ↓ 17.2%
Listing photo for 25 Canongate No. 2

25 Canongate

HU16 4DG · Detached · 2 bed

Was £260,000 (Jul 2023)
Now £220,000 (Aug 2025)
Price change -£40,000 over 2.1 yrs
Total % -15.4%
Annualised % ↓ 7.6%
Listing photo for 28 Springs Court Field Close No. 3

28 Springs Court Field Close

HU16 5GX · Flat

Was £283,999 (Apr 2022)
Now £220,000 (Sep 2025)
Price change -£63,999 over 3.4 yrs
Total % -22.5%
Annualised % ↓ 7.3%
Listing photo for 1 Bedale Avenue No. 4

1 Bedale Avenue

HU9 3AN · Terrace · 2 bed

Was £106,000 (Dec 2022)
Now £90,000 (Jul 2025)
Price change -£16,000 over 2.5 yrs
Total % -15.1%
Annualised % ↓ 6.2%
Listing photo for 23 Main Street No. 5

23 Main Street

HU12 8UB · Terrace · 3 bed

Was £155,000 (Dec 2022)
Now £132,000 (Jun 2025)
Price change -£23,000 over 2.5 yrs
Total % -14.8%
Annualised % ↓ 6.2%
Listing photo for 7 Fisher Square No. 6

7 Fisher Square

HU17 8HG · Terrace · 3 bed

Was £197,000 (Oct 2023)
Now £170,000 (Mar 2026)
Price change -£27,000 over 2.4 yrs
Total % -13.7%
Annualised % ↓ 6.0%
Listing photo for 40 Damson Road No. 7

40 Damson Road

HU12 9QL · Semi-D · 3 bed

Was £220,000 (Dec 2022)
Now £185,000 (Dec 2025)
Price change -£35,000 over 3.0 yrs
Total % -15.9%
Annualised % ↓ 5.7%
Listing photo for 18 Woodland Rise No. 8

18 Woodland Rise

HU11 4GA · Detached · 5 bed

Was £385,000 (Nov 2015)
Now £219,000 (Sep 2025)
Price change -£166,000 over 9.8 yrs
Total % -43.1%
Annualised % ↓ 5.6%
Listing photo for 10 Grange Crescent No. 9

10 Grange Crescent

HU10 7AU · Semi-D · 2 bed

Was £185,000 (Apr 2017)
Now £113,500 (Feb 2026)
Price change -£71,500 over 8.8 yrs
Total % -38.6%
Annualised % ↓ 5.4%
Listing photo for 149 Goddard Avenue No. 10

149 Goddard Avenue

HU5 2BN · Terrace · 3 bed

Was £94,000 (Dec 2020)
Now £70,000 (Apr 2026)
Price change -£24,000 over 5.4 yrs
Total % -25.5%
Annualised % ↓ 5.4%
Listing photo for 56 Highgrove Way No. 11

56 Highgrove Way

HU7 3JU · Detached · 3 bed

Was £175,000 (Sep 2022)
Now £152,500 (Jul 2025)
Price change -£22,500 over 2.8 yrs
Total % -12.9%
Annualised % ↓ 4.7%
Listing photo for Flat 17 Old Harbour Court, 10 Wincolmlee No. 12

Flat 17 Old Harbour Court, 10 Wincolmlee

HU2 8HZ · Flat

Was £102,000 (Jan 2023)
Now £88,200 (Apr 2026)
Price change -£13,800 over 3.2 yrs
Total % -13.5%
Annualised % ↓ 4.5%
Listing photo for 76 Mill View Road No. 13

76 Mill View Road

HU17 0UQ · Semi-D · 3 bed

Was £265,000 (Nov 2022)
Now £230,000 (Jan 2026)
Price change -£35,000 over 3.2 yrs
Total % -13.2%
Annualised % ↓ 4.3%
Listing photo for 45 Grosvenor Road No. 14

45 Grosvenor Road

HU7 3DS · Terrace

Was £152,500 (Mar 2023)
Now £138,000 (Jun 2025)
Price change -£14,500 over 2.3 yrs
Total % -9.5%
Annualised % ↓ 4.3%
Listing photo for 38 Waudby Way No. 15

38 Waudby Way

HU9 4DF · Semi-D

Was £165,995 (Jul 2022)
Now £145,000 (Sep 2025)
Price change -£20,995 over 3.1 yrs
Total % -12.7%
Annualised % ↓ 4.3%

Ladders — largest house price rises in HU

The top-ranked HU properties with the biggest house price rises on resale. Go beyond house price indices with specific examples.

Listing photo for 35 Northolme Crescent No. 1

35 Northolme Crescent

HU13 9HU · Detached

Was £5,000 (Dec 2021)
Now £212,000 (Sep 2025)
Price change +£207,000 over 3.7 yrs
Total % 4140.0%
Annualised % ↑ 173.2%
Listing photo for 9 Salisbury Street No. 2

9 Salisbury Street

HU13 0SE · Semi-D · 4 bed

Was £115,000 (Feb 2023)
Now £204,500 (Jun 2025)
Price change +£89,500 over 2.3 yrs
Total % 77.8%
Annualised % ↑ 27.9%
Listing photo for 155 Anlaby Park Road South No. 3

155 Anlaby Park Road South

HU4 7DB · Terrace

Was £126,000 (Feb 2024)
Now £210,000 (Mar 2026)
Price change +£84,000 over 2.1 yrs
Total % 66.7%
Annualised % ↑ 27.7%
Listing photo for Flat 5 125 Princes Avenue No. 4

Flat 5 125 Princes Avenue

HU5 3HH · Flat · 1 bed

Was £28,000 (Mar 2022)
Now £58,000 (Aug 2025)
Price change +£30,000 over 3.5 yrs
Total % 107.1%
Annualised % ↑ 23.4%
Listing photo for 14 Minster Moorgate No. 5

14 Minster Moorgate

HU17 8HR · Terrace · 2 bed

Was £210,000 (Aug 2023)
Now £325,000 (Oct 2025)
Price change +£115,000 over 2.1 yrs
Total % 54.8%
Annualised % ↑ 22.6%
Listing photo for 50 Colville Avenue No. 6

50 Colville Avenue

HU4 7RJ · Terrace · 3 bed

Was £132,000 (Oct 2023)
Now £185,000 (Dec 2025)
Price change +£53,000 over 2.2 yrs
Total % 40.2%
Annualised % ↑ 17.0%
Listing photo for 138 Hall Road No. 7

138 Hall Road

HU6 8SB · Terrace · 3 bed

Was £134,950 (Feb 2022)
Now £230,000 (Dec 2025)
Price change +£95,050 over 3.8 yrs
Total % 70.4%
Annualised % ↑ 15.0%
Listing photo for 135 Westlands Road No. 8

135 Westlands Road

HU5 5NX · Terrace · 3 bed

Was £94,500 (Dec 2020)
Now £180,000 (Aug 2025)
Price change +£85,500 over 4.7 yrs
Total % 90.5%
Annualised % ↑ 14.8%
Listing photo for 49 Burton Road No. 9

49 Burton Road

HU16 5DZ · Semi-D · 3 bed

Was £210,000 (Oct 2022)
Now £300,000 (Aug 2025)
Price change +£90,000 over 2.8 yrs
Total % 42.9%
Annualised % ↑ 13.3%
Listing photo for 66 Evergreen Drive No. 10

66 Evergreen Drive

HU6 7YD · Semi-D · 2 bed

Was £82,000 (Aug 2018)
Now £207,000 (Feb 2026)
Price change +£125,000 over 7.4 yrs
Total % 152.4%
Annualised % ↑ 13.3%
Listing photo for 18 Etherington Road No. 11

18 Etherington Road

HU6 7JS · Terrace · 3 bed

Was £127,000 (Sep 2023)
Now £166,500 (Dec 2025)
Price change +£39,500 over 2.2 yrs
Total % 31.1%
Annualised % ↑ 13.2%
Listing photo for 1 Royal Mail Cottages No. 12

1 Royal Mail Cottages

HU12 9NF · Terrace · 2 bed

Was £89,000 (Apr 2022)
Now £135,000 (Sep 2025)
Price change +£46,000 over 3.4 yrs
Total % 51.7%
Annualised % ↑ 13.2%
Listing photo for 133 Beech Road No. 13

133 Beech Road

HU15 1JZ · Semi-D · 2 bed

Was £165,055 (May 2021)
Now £285,000 (Nov 2025)
Price change +£119,945 over 4.5 yrs
Total % 72.7%
Annualised % ↑ 13.0%
Listing photo for 13 Bridge Bungalows No. 14

13 Bridge Bungalows

HU12 9JS · Semi-D · 3 bed

Was £155,000 (Nov 2017)
Now £407,000 (Dec 2025)
Price change +£252,000 over 8.0 yrs
Total % 162.6%
Annualised % ↑ 12.8%
Listing photo for 34 Carrs Meadow No. 15

34 Carrs Meadow

HU19 2ER · Semi-D · 2 bed

Was £110,000 (Aug 2021)
Now £168,000 (Jun 2025)
Price change +£58,000 over 3.8 yrs
Total % 52.7%
Annualised % ↑ 11.7%

Frequently asked questions

Each entry links sales by the address and property type from Land Registry, with two registered sales at least two years apart. The latest sale was in the last 12 months. Prices are nominal — not adjusted for extensions, condition, or inflation. We show listings with archived photos and floorplans where available (15 snakes, 15 ladders).

A fall is not always a market crash story. Land Registry data input errors, Lease or title changes, part ownership, mis-matched addresses can all influence the numbers. This is not analysis nor is it investment advice, just a bit of fun.

We link sales based on the address and property type provided by Land Registry. We then compare the latest sale to the immediately previous registered sale on that address.

Back to HU house price analysis