House prices in BB6 (Great Harwood)
Price per square metre data and charts to help you understand the housing market in BB6 - stats were last calculated on 08 October 2026.
Defining 'BB6'
This analysis is limited to properties whose postcode starts with "BB6", this is also called the postcode district. There are no official postcode district names so I've just labelled it BB6, Great Harwood. It is shown in red on the map below.
Want to change geography?
You can click on the map above to change to a neighbouring district, or you can use the search form below.
Price per square metre
Knowing the average house price in BB6 is not much use. However, knowing average price per square metre can be quite useful. Price per sqm allows some comparison between properties of different size. We define price per square metre as the sold price divided by the internal area of a property:
£ per sqm = price ÷ internal area
For example in August 2026, 24, Maple Street, Great Harwood, BB6 7RY sold for £143,000. Given the internal area of 101 square metres recorded on the EPC, the price per sqm is £143,000 ÷ 101 sqm = £1,415.
England & Wales have been officially metric since 1965. However house price per square foot is prefered by some estate agents and those of sufficiently advanced age ;-). You can change your prefered units from square meters to square feet for all the graphs and charts on BB6 and elsewhere. Just visit the My Account page and look for the m2 to ft2 toggle switch. Alternatively just multiply everything by 10, move a decimal place to go from sqm to sqft and you'll be close enough as 1 sqm = 10.76391 sqft.
Distribution of £ per sqm for houses vs flats in BB6
The chart above is called a histogram, it helps you see the distribution of house price per sqm in BB6 To make this chart we put all the sales data into a series of £ per sqm 'buckets' (e.g. £2,130 to £2,280, £2,280 to £2,430, £2,430 to £2,580 etc...) we then count the number of sales with within in each bucket and plot the results. The histogram is based on 535 sales that took place in BB6, in the last 24 months.
Generate a custom histogram like the one above but based on your own criteria.
You can see the spread of prices above. This is because although internal area is a key factor in determining valuation, it is not the only factor. Many factors other than size affect desirability; these factors could be condition, aspect, garden size, negotiating power of the vendor etc.
The spread of prices will give you a feel of the typical range to expect in BB6, Great Harwood. Notably, only 25% of properties that sold recently were valued at more than £2,720 sqm. For anything to be valued more than this means it has to be more desireable than the clear majority of BB6 homes.
Box plot of £ per sqm for BB6
Tip: click on the chart to see the values.
The chart above is called a boxplot (or a box-and-whisker plot). Box plots, like histograms, are used to graphically represent the distribution of data, showing the central tendency, spread of the distribution. In the context of £ per square metre property price distributions, box plots represent the variation in property prices within a geographic area e.g. Great Harwood. The chart above shows a boxplot for 'BB6' as well as the 'BB' postcode area.
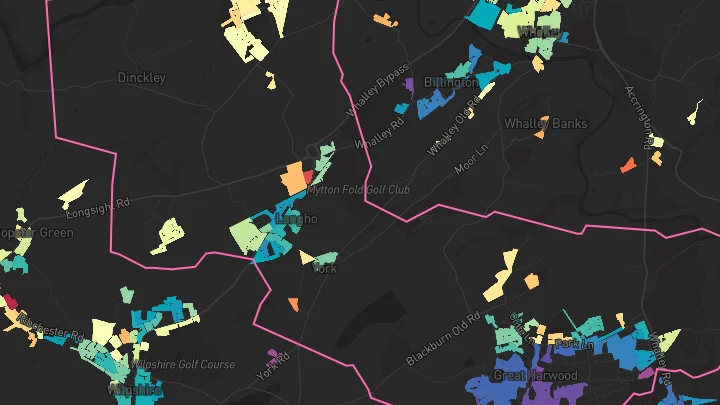
Property price map for Great Harwood
Have a look at the interactive price map I created for myself. Use it to explore house prices in 'Great Harwood' all the way down to individual property plots.
Will BB6 house prices drop in 2025?
House prices in BB6 fell -9.7% in the last year, -12.5% after inflation. Whether or not this trend will continue depends on many factors, such as wage growth, net migration, interest rates and the level of house building. No one can predict these things with certainty however we can plot the historic trends in house prices in BB6 (Great Harwood) compared with the wider postcode area 'BB'.You can extrapolate from this based on your own views.
House price index for BB6
Tip: click on the legend items to show/hide different lines
Download house price index as CSV (premium users only).
The chart above shows changes in 'BB6' property prices over the last 20 years. The index is calculated from the average price paid per sqm for property in BB6 and is set to 100 in 2004. The chart compares trends for BB6, Great Harwood against those of the broader postcode area 'BB'. What is more interesting is to look at the difference between flats and houses, even those in the same area follow a very different trend, to get a robust enough sample size to see this we need to zoom out and look at house price trends for the entire Hyndburn local authority.
The dashed lines show nominal house price changes, the solid lines show the same data adjusted for inflation. Economists call this the 'real' price change. You have to take inflation into account when comparing prices over time. It's calculated using the formula:
Real Rate of Return = (1 + Nominal Rate) ÷ (1 + Inflation Rate) – 1In this formula, the nominal rate is the rate of change before any adjustments, and the inflation rate is taken from the Consumer Price Index. The real rate of return is a more accurate measure of change in value, because £1 today does not have the same buying power as £1 in the past. For example, if a savings account pays an interest rate of 3% per year and the inflation rate is 5% per year, the real rate of return is -2%. This means that the investment's value is shrinking by 2% each year.
Historic returns for BB6
| BB area | BB6 district | |||
|---|---|---|---|---|
| Nominal | Real | Nominal | Real | |
| 20 yr per annum | 2.8% | -0.0% | 2.1% | -0.7% |
| 20 yr total | 73.5% | -0.4% | 50.6% | -13.6% |
| 10 yr per annum | 4.6% | 1.2% | 2.8% | -0.6% |
| 10 yr total | 57.3% | 12.8% | 31.4% | -5.8% |
| 5 yr per annum | 4.0% | -0.9% | 2.9% | -2.0% |
| 5 yr total | 21.8% | -4.5% | 15.1% | -9.8% |
| 1 yr per annum | 3.0% | -0.2% | -9.7% | -12.5% |
| 1 yr total | 3.0% | -0.2% | -9.7% | -12.5% |
This table complements the house price index chart above, presenting the data in a more detailed format. It breaks down the information into 20-year, 10-year, 5-year, and 1-year periods, further categorized by property type. For each period, we display both a per annum rate of change and a total rate of change.
The total rate of change represents the overall change over the entire period. The formula for total return is:
Total return = (Index at end of period ÷ Index at start of period) - 1
The per annum rate of change is the annualized rate of change over the period. This is equivalent to the annual bank savings rate you would need to achieve the same total return over the given period. This annualized return is also known as the Compound Annual Growth Rate (CAGR). The formula for CAGR is:
CAGR = (1 + Total return) ^ (1 ÷ Number of years) - 1
Some specific examples:
- Over the past 20 years, BB6 district have seen a -0.7% annual change when adjusted for inflation. This translates to a total change of -13.6% in real terms.
- Over the past 5 years, BB area have seen a -0.9% annual change when adjusted for inflation. This translates to a total change of -4.5% in real terms.
Most recent BB6 sales
For the most recent sales activity, rather than a summarized average, it is better to see the underlying data. This is shown in the chart below, where blue dots represent individual sales, click on them to see details. If there is an obvious trend you should be able to spot it here amid the noise from outliers.
Tip: hover over dots to see details
Snakes & Ladders
See the recent winners & losers in the BB6 property market. This is not deep analysis - it is a nosy, tabloid-style peek at the local property market.

Street level data
| Street | Avg size | Avg £sqm | Recent sales |
|---|---|---|---|
| Holdsworth Drive, , BB6 7F | 93 sqm | £2,463 | 22 |
| James Street, , BB6 7J | 91 sqm | £1,311 | 18 |
| Water Street, , BB6 7Q | 85 sqm | £1,769 | 18 |
| Windsor Road, , BB6 7R | 94 sqm | £1,285 | 16 |
| Whalley Road, , BB6 8E | 94 sqm | £2,798 | 15 |
| Church Street, , BB6 7Q | 82 sqm | £1,523 | 13 |
| The Rydings, , BB6 8B | 168 sqm | £2,952 | 11 |
| Clayton Street, , BB6 7A | 80 sqm | £1,010 | 11 |
Search for your street here.
BB6's constituents
The analysis on this page encompasses the entirety of BB6. If you want more granular analysis on different parts of BB6, use these links.
| Postcode sector | Lower quartile | Median | Upper quartile | Sales in last 2yr |
|---|---|---|---|---|
| BB6 7 Great Harwood | £1,140 sqm | £1,540 sqm | £2,300 sqm | 403 |
| BB6 8 Langho | £2,550 sqm | £2,880 sqm | £3,290 sqm | 132 |
Nearby geographies
The table below shows how 'BB6' compares to the other postcode districts nearby 'BB6'.
| District | Lower quartile | Median | Upper quartile | Sales in last 2yr |
|---|---|---|---|---|
| PR3 Longridge | £2,210 sqm | £2,670 sqm | £3,070 sqm | 1,641 |
| BB9 Nelson | £1,030 sqm | £1,480 sqm | £2,120 sqm | 1,313 |
| BB8 Colne | £1,170 sqm | £1,690 sqm | £2,420 sqm | 832 |
| BB7 Clitheroe | £2,240 sqm | £2,850 sqm | £3,420 sqm | 1,306 |
| BB6 Great Harwood | £1,290 sqm | £1,930 sqm | £2,720 sqm | 535 |
| BB5 Accrington | £1,070 sqm | £1,520 sqm | £2,210 sqm | 1,792 |
| BB4 Haslingden | £1,690 sqm | £2,230 sqm | £2,950 sqm | 1,309 |
| BB3 Darwen | £1,220 sqm | £1,710 sqm | £2,400 sqm | 1,393 |
| BB2 Blackburn | £1,350 sqm | £1,990 sqm | £2,640 sqm | 1,918 |
| BB18 Barnoldswick | £1,470 sqm | £1,810 sqm | £2,460 sqm | 611 |
Raw data
Our analysis of BB6 is derived from what is essentially a big table of sold prices from Land Registry with added property size information. Below are three rows from this table to give you an idea.
| Address | Paid | sqm | £/sqm |
|---|---|---|---|
| 24, Maple St, | £143,000
Aug-2026
|
101 | 1,415 |
| 41, Park Lane, | £142,250
Aug-2026
|
87 | 1,635 |
| 43, George St, | £70,000
Aug-2026
|
82 | 853 |
See the entire list of all sales in BB6 here.
About
I created HouseMetric because I wanted to see this data and analysis myself, I also wanted to teach myself to build a website. Please give me feedback or spread the word about it. I'm constantly tinkering and adding more stuff to it.