Property Snakes & Ladders in CA11

The biggest price drops and jumps on homes sold in the last year, compared with their previous Land Registry sale - curiosity, not analysis.

Rankings from Land Registry resales, last calculated 05 June 2026.

Explore another area

Snakes — biggest house price falls in CA11

The top-ranked CA11 properties with the largest house price falls on resale. Go beyond house price indices with specific examples.
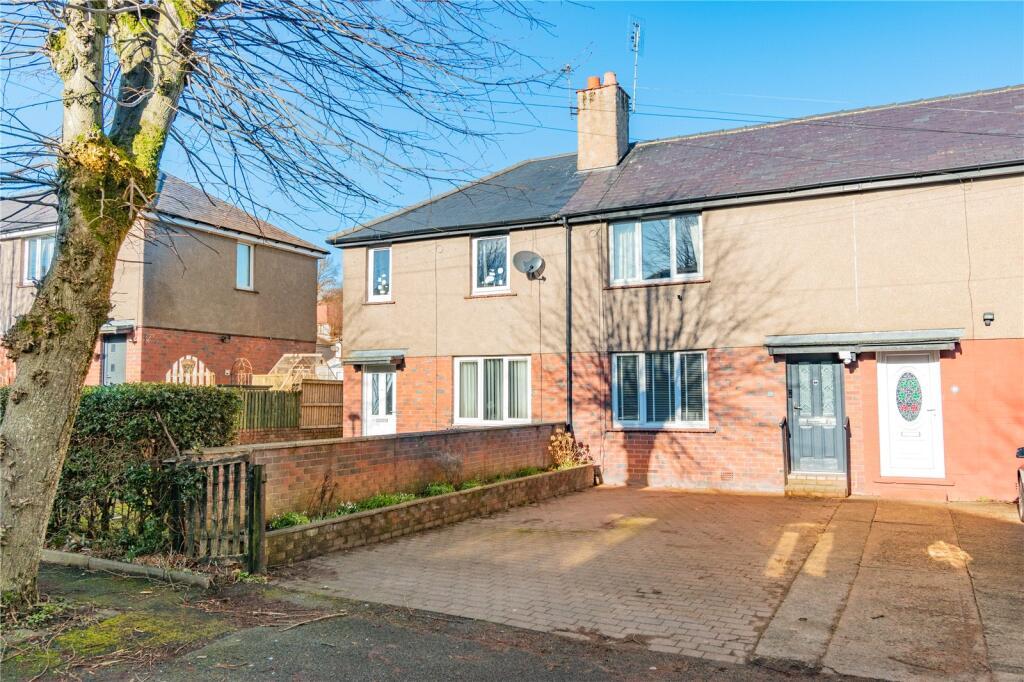
Listing photo for 7 Bracken Court No. 1

7 Bracken Court

CA11 9QU · Semi-D · 3 bed

Was £218,500 (Dec 2022)
Now £135,000 (Apr 2026)
Price change -£83,500 over 3.3 yrs
Total % -38.2%
Annualised % ↓ 13.4%
Listing photo for Flat 54 Woodlands Bridge Lane No. 2

Flat 54 Woodlands Bridge Lane

CA11 8GW · Flat

Was £179,950 (May 2021)
Now £92,000 (Feb 2026)
Price change -£87,950 over 4.7 yrs
Total % -48.9%
Annualised % ↓ 13.3%
Listing photo for Flat 43 Woodlands Bridge Lane No. 3

Flat 43 Woodlands Bridge Lane

CA11 8GW · Flat

Was £150,000 (May 2019)
Now £80,000 (Mar 2026)
Price change -£70,000 over 6.8 yrs
Total % -46.7%
Annualised % ↓ 8.8%
Listing photo for Apartment 21 Dutton Lodge Roper Street No. 4

Apartment 21 Dutton Lodge Roper Street

CA11 8FY · Flat

Was £286,950 (Oct 2022)
Now £225,000 (Dec 2025)
Price change -£61,950 over 3.1 yrs
Total % -21.6%
Annualised % ↓ 7.5%
Listing photo for Flat 36 Woodlands Bridge Lane No. 5

Flat 36 Woodlands Bridge Lane

CA11 8GW · Flat

Was £163,000 (Oct 2016)
Now £105,000 (Aug 2025)
Price change -£58,000 over 8.8 yrs
Total % -35.6%
Annualised % ↓ 4.9%
Listing photo for 23 Graham Street No. 6

23 Graham Street

CA11 9LG · Semi-D · 3 bed

Was £270,000 (Mar 2020)
Now £205,000 (Dec 2025)
Price change -£65,000 over 5.7 yrs
Total % -24.1%
Annualised % ↓ 4.7%
Listing photo for Byre House No. 7

Byre House

CA11 0EP · Detached

Was £775,000 (Oct 2022)
Now £700,000 (Oct 2025)
Price change -£75,000 over 3.0 yrs
Total % -9.7%
Annualised % ↓ 3.3%
Listing photo for 18 Scotland Road No. 8

18 Scotland Road

CA11 7NN · Detached

Was £150,000 (Sep 2007)
Now £125,000 (Oct 2025)
Price change -£25,000 over 18.1 yrs
Total % -16.7%
Annualised % ↓ 1.0%
Listing photo for 30 Greystoke Park Road No. 9

30 Greystoke Park Road

CA11 9BT · Semi-D · 2 bed

Was £140,000 (May 2021)
Now £135,000 (Dec 2025)
Price change -£5,000 over 4.5 yrs
Total % -3.6%
Annualised % ↓ 0.8%
Listing photo for 4 Croft Terrace No. 10

4 Croft Terrace

CA11 7RW · Semi-D · 5 bed

Was £286,000 (May 2007)
Now £250,000 (Dec 2025)
Price change -£36,000 over 18.6 yrs
Total % -12.6%
Annualised % ↓ 0.7%
Listing photo for 55 Burney Road No. 11

55 Burney Road

CA11 8FU · Semi-D

Was £255,000 (Apr 2023)
Now £252,500 (Sep 2025)
Price change -£2,500 over 2.5 yrs
Total % -1.0%
Annualised % ↓ 0.4%
Listing photo for 53 Pategill Road No. 12

53 Pategill Road

CA11 8JT · Terrace · 2 bed

Was £142,000 (Sep 2006)
Now £135,000 (Jun 2025)
Price change -£7,000 over 18.8 yrs
Total % -4.9%
Annualised % ↓ 0.3%
Listing photo for Styan Bew No. 13

Styan Bew

CA11 0NZ · Detached · 4 bed

Was £630,000 (May 2020)
Now £625,000 (Jul 2025)
Price change -£5,000 over 5.2 yrs
Total % -0.8%
Annualised % ↓ 0.1%
Listing photo for 15 Castle Foundry No. 14

15 Castle Foundry

CA11 7DH · Flat · 2 bed

Was £157,000 (Feb 2012)
Now £156,500 (Aug 2025)
Price change -£500 over 13.5 yrs
Total % -0.3%
Annualised % ↓ 0.0%

Ladders — largest house price rises in CA11

The top-ranked CA11 properties with the biggest house price rises on resale. Go beyond house price indices with specific examples.

Listing photo for Malvern No. 1

Malvern

CA11 0HL · Semi-D · 3 bed

Was £190,000 (Feb 2021)
Now £605,000 (Sep 2025)
Price change +£415,000 over 4.6 yrs
Total % 218.4%
Annualised % ↑ 29.0%
Listing photo for 11 York Street No. 2

11 York Street

CA11 9DA · Terrace · 3 bed

Was £126,000 (Jul 2023)
Now £185,000 (Jul 2025)
Price change +£59,000 over 2.0 yrs
Total % 46.8%
Annualised % ↑ 21.1%
Listing photo for 16 Milner Mount No. 3

16 Milner Mount

CA11 8HD · Semi-D · 3 bed

Was £159,000 (Feb 2023)
Now £207,500 (Aug 2025)
Price change +£48,500 over 2.5 yrs
Total % 30.5%
Annualised % ↑ 11.5%
Listing photo for Lane End No. 4

Lane End

CA11 0XY · Detached

Was £235,000 (May 2018)
Now £470,000 (Nov 2025)
Price change +£235,000 over 7.4 yrs
Total % 100.0%
Annualised % ↑ 9.8%
Listing photo for 78 Clifford Road No. 5

78 Clifford Road

CA11 8PT · Semi-D · 2 bed

Was £165,000 (May 2020)
Now £265,000 (Apr 2026)
Price change +£100,000 over 5.9 yrs
Total % 60.6%
Annualised % ↑ 8.4%
Listing photo for 6 Stybarrow Terrace No. 6

6 Stybarrow Terrace

CA11 0QD · Semi-D

Was £321,000 (Oct 2019)
Now £500,000 (Oct 2025)
Price change +£179,000 over 6.0 yrs
Total % 55.8%
Annualised % ↑ 7.7%
Listing photo for 11 Field House Gardens No. 7

11 Field House Gardens

CA11 9EZ · Detached · 3 bed

Was £207,500 (Aug 2020)
Now £300,000 (Aug 2025)
Price change +£92,500 over 5.0 yrs
Total % 44.6%
Annualised % ↑ 7.6%
Listing photo for 7 Laikin View No. 8

7 Laikin View

CA11 9QW · Detached · 3 bed

Was £175,000 (Oct 2016)
Now £320,000 (Oct 2025)
Price change +£145,000 over 9.0 yrs
Total % 82.9%
Annualised % ↑ 6.9%
Listing photo for 2 Aikbank Cottages No. 9

2 Aikbank Cottages

CA11 9RU · Semi-D

Was £165,000 (Oct 2018)
Now £270,000 (Feb 2026)
Price change +£105,000 over 7.3 yrs
Total % 63.6%
Annualised % ↑ 6.9%
Listing photo for 20 Cedar Close No. 10

20 Cedar Close

CA11 8TJ · Semi-D · 2 bed

Was £185,000 (Dec 2020)
Now £257,000 (Nov 2025)
Price change +£72,000 over 4.9 yrs
Total % 38.9%
Annualised % ↑ 6.9%
Listing photo for 9 Centurion Rise No. 11

9 Centurion Rise

CA11 8BQ · Detached

Was £217,950 (Sep 2018)
Now £350,000 (Nov 2025)
Price change +£132,050 over 7.1 yrs
Total % 60.6%
Annualised % ↑ 6.9%
Listing photo for Spinney Corner Berrier Road No. 12

Spinney Corner Berrier Road

CA11 0UE · Detached · 2 bed

Was £95,000 (Dec 2000)
Now £425,000 (Jun 2025)
Price change +£330,000 over 24.5 yrs
Total % 347.4%
Annualised % ↑ 6.3%
Listing photo for 48 Crocus Avenue No. 13

48 Crocus Avenue

CA11 8FE · Detached

Was £335,000 (May 2022)
Now £423,750 (Mar 2026)
Price change +£88,750 over 3.8 yrs
Total % 26.5%
Annualised % ↑ 6.3%
Listing photo for 28 Tyne Close Avenue No. 14

28 Tyne Close Avenue

CA11 7ER · Terrace · 2 bed

Was £124,000 (Jan 2021)
Now £165,000 (Oct 2025)
Price change +£41,000 over 4.8 yrs
Total % 33.1%
Annualised % ↑ 6.1%
Listing photo for 11 Warwick Place No. 15

11 Warwick Place

CA11 7DT · Semi-D · 3 bed

Was £132,000 (Jun 2019)
Now £195,500 (Mar 2026)
Price change +£63,500 over 6.7 yrs
Total % 48.1%
Annualised % ↑ 6.0%

Frequently asked questions

Each entry links sales by the address and property type from Land Registry, with two registered sales at least two years apart. The latest sale was in the last 12 months. Prices are nominal — not adjusted for extensions, condition, or inflation. We show listings with archived photos and floorplans where available (15 snakes, 15 ladders).

A fall is not always a market crash story. Land Registry data input errors, Lease or title changes, part ownership, mis-matched addresses can all influence the numbers. This is not analysis nor is it investment advice, just a bit of fun.

We link sales based on the address and property type provided by Land Registry. We then compare the latest sale to the immediately previous registered sale on that address.

Back to CA11 house price analysis