Property Snakes & Ladders in CW2

The biggest price drops and jumps on homes sold in the last year, compared with their previous Land Registry sale - curiosity, not analysis.

Rankings from Land Registry resales, last calculated 05 June 2026.

Explore another area

Snakes — biggest house price falls in CW2

The top-ranked CW2 properties with the largest house price falls on resale. Go beyond house price indices with specific examples.

Listing photo for 33 Somerville Street No. 1

33 Somerville Street

CW2 7NP · Terrace · 2 bed

Was £100,000 (Feb 2017)
Now £55,000 (Sep 2025)
Price change -£45,000 over 8.6 yrs
Total % -45.0%
Annualised % ↓ 6.7%
Listing photo for 2 Tilstone Close No. 2

2 Tilstone Close

CW2 5RQ · Detached · 2 bed

Was £315,000 (Sep 2021)
Now £252,000 (Jun 2025)
Price change -£63,000 over 3.7 yrs
Total % -20.0%
Annualised % ↓ 5.8%
Listing photo for Flat 2 Gainsborough Court, 59 Stewart Street No. 3

Flat 2 Gainsborough Court, 59 Stewart Street

CW2 8BG · Flat · 1 bed

Was £89,500 (Feb 2008)
Now £72,500 (Jun 2025)
Price change -£17,000 over 17.3 yrs
Total % -19.0%
Annualised % ↓ 1.2%
Listing photo for 24a Rope Lane No. 4

24a Rope Lane

CW2 6RD · Detached · 2 bed

Was £250,000 (Jan 2021)
Now £242,500 (Feb 2026)
Price change -£7,500 over 5.1 yrs
Total % -3.0%
Annualised % ↓ 0.6%
Listing photo for 2 Freshfields No. 5

2 Freshfields

CW2 6QD · Semi-D · 3 bed

Was £280,800 (Sep 2021)
Now £275,000 (Dec 2025)
Price change -£5,800 over 4.2 yrs
Total % -2.1%
Annualised % ↓ 0.5%
Listing photo for 20 Henry Hughes Drive No. 6

20 Henry Hughes Drive

CW2 5GB · Semi-D

Was £235,995 (Nov 2022)
Now £235,000 (Sep 2025)
Price change -£995 over 2.9 yrs
Total % -0.4%
Annualised % ↓ 0.1%
Listing photo for 27 Cattle Way No. 7

27 Cattle Way

CW2 5UL · Semi-D

Was £205,995 (Oct 2021)
Now £205,000 (Jun 2025)
Price change -£995 over 3.7 yrs
Total % -0.5%
Annualised % ↓ 0.1%

Ladders — largest house price rises in CW2

The top-ranked CW2 properties with the biggest house price rises on resale. Go beyond house price indices with specific examples.
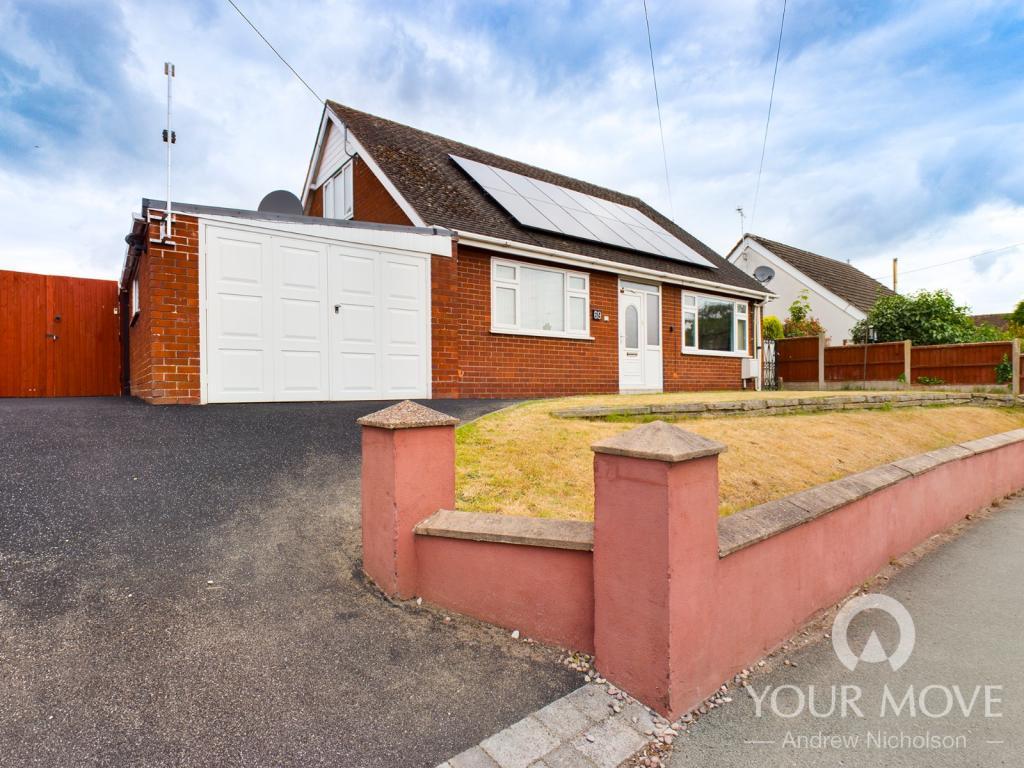
Listing photo for 69 Church Lane No. 1

69 Church Lane

CW2 8EZ · Detached · 2 bed

Was £215,000 (Jul 2023)
Now £375,000 (Dec 2025)
Price change +£160,000 over 2.4 yrs
Total % 74.4%
Annualised % ↑ 25.5%
Listing photo for 27 Manor Way No. 2

27 Manor Way

CW2 6JY · Semi-D · 3 bed

Was £124,000 (Aug 2022)
Now £195,000 (Sep 2025)
Price change +£71,000 over 3.1 yrs
Total % 57.3%
Annualised % ↑ 15.5%
Listing photo for 309 Newcastle Road No. 3

309 Newcastle Road

CW2 5EA · Terrace · 2 bed

Was £146,000 (Oct 2023)
Now £200,000 (Feb 2026)
Price change +£54,000 over 2.4 yrs
Total % 37.0%
Annualised % ↑ 14.2%
Listing photo for 25 Merrills Avenue No. 4

25 Merrills Avenue

CW2 8SP · Semi-D · 2 bed

Was £145,000 (Dec 2022)
Now £212,500 (Dec 2025)
Price change +£67,500 over 3.0 yrs
Total % 46.6%
Annualised % ↑ 13.6%
Listing photo for 267 Nantwich Road No. 5

267 Nantwich Road

CW2 6PF · Terrace · 4 bed

Was £150,000 (Jul 2021)
Now £256,000 (Oct 2025)
Price change +£106,000 over 4.2 yrs
Total % 70.7%
Annualised % ↑ 13.5%
Listing photo for 30 Victoria Avenue No. 6

30 Victoria Avenue

CW2 7SQ · Semi-D · 3 bed

Was £100,000 (Oct 2016)
Now £280,000 (Feb 2026)
Price change +£180,000 over 9.4 yrs
Total % 180.0%
Annualised % ↑ 11.6%
Listing photo for 12 Ruskin Road No. 7

12 Ruskin Road

CW2 7JR · Terrace · 3 bed

Was £144,000 (Feb 2023)
Now £187,000 (Sep 2025)
Price change +£43,000 over 2.5 yrs
Total % 29.9%
Annualised % ↑ 10.9%
Listing photo for 18 Clyde Grove No. 8

18 Clyde Grove

CW2 8NA · Semi-D · 3 bed

Was £135,000 (Jul 2019)
Now £250,000 (Aug 2025)
Price change +£115,000 over 6.1 yrs
Total % 85.2%
Annualised % ↑ 10.6%
Listing photo for 519 Crewe Road No. 9

519 Crewe Road

CW2 6PY · Detached · 3 bed

Was £275,000 (Jun 2018)
Now £555,000 (Jun 2025)
Price change +£280,000 over 7.0 yrs
Total % 101.8%
Annualised % ↑ 10.5%
Listing photo for 5 Gresty Lane No. 10

5 Gresty Lane

CW2 5DD · Semi-D · 2 bed

Was £165,000 (Jan 2022)
Now £242,000 (Dec 2025)
Price change +£77,000 over 3.9 yrs
Total % 46.7%
Annualised % ↑ 10.4%
Listing photo for 302 Newcastle Road No. 11

302 Newcastle Road

CW2 5EA · Flat · 3 bed

Was £190,000 (Dec 2020)
Now £310,000 (Nov 2025)
Price change +£120,000 over 5.0 yrs
Total % 63.2%
Annualised % ↑ 10.3%
Listing photo for 456 Crewe Road No. 12

456 Crewe Road

CW2 6PZ · Semi-D · 3 bed

Was £192,500 (Oct 2018)
Now £382,000 (Mar 2026)
Price change +£189,500 over 7.4 yrs
Total % 98.4%
Annualised % ↑ 9.7%
Listing photo for 123 Crewe Road No. 13

123 Crewe Road

CW2 5DL · Semi-D · 3 bed

Was £150,000 (Mar 2021)
Now £232,000 (Dec 2025)
Price change +£82,000 over 4.7 yrs
Total % 54.7%
Annualised % ↑ 9.7%
Listing photo for 28 Christleton Avenue No. 14

28 Christleton Avenue

CW2 8TD · Semi-D · 3 bed

Was £110,000 (Sep 2018)
Now £210,000 (Dec 2025)
Price change +£100,000 over 7.3 yrs
Total % 90.9%
Annualised % ↑ 9.3%
Listing photo for 34 Belgrave Road No. 15

34 Belgrave Road

CW2 7NH · Semi-D · 3 bed

Was £133,000 (Oct 2015)
Now £305,000 (Jul 2025)
Price change +£172,000 over 9.8 yrs
Total % 129.3%
Annualised % ↑ 8.8%

Frequently asked questions

Each entry links sales by the address and property type from Land Registry, with two registered sales at least two years apart. The latest sale was in the last 12 months. Prices are nominal — not adjusted for extensions, condition, or inflation. We show listings with archived photos and floorplans where available (15 snakes, 15 ladders).

A fall is not always a market crash story. Land Registry data input errors, Lease or title changes, part ownership, mis-matched addresses can all influence the numbers. This is not analysis nor is it investment advice, just a bit of fun.

We link sales based on the address and property type provided by Land Registry. We then compare the latest sale to the immediately previous registered sale on that address.

Back to CW2 house price analysis