Property Snakes & Ladders in FY5

The biggest price drops and jumps on homes sold in the last year, compared with their previous Land Registry sale - curiosity, not analysis.

Rankings from Land Registry resales, last calculated 05 June 2026.

Explore another area

Snakes — biggest house price falls in FY5

The top-ranked FY5 properties with the largest house price falls on resale. Go beyond house price indices with specific examples.

Listing photo for 44 Brookfield Road No. 1

44 Brookfield Road

FY5 4DT · Terrace · 3 bed

Was £140,000 (Sep 2021)
Now £110,000 (Jul 2025)
Price change -£30,000 over 3.9 yrs
Total % -21.4%
Annualised % ↓ 6.1%
Listing photo for 16 Station Road No. 2

16 Station Road

FY5 5HY · Detached · 3 bed
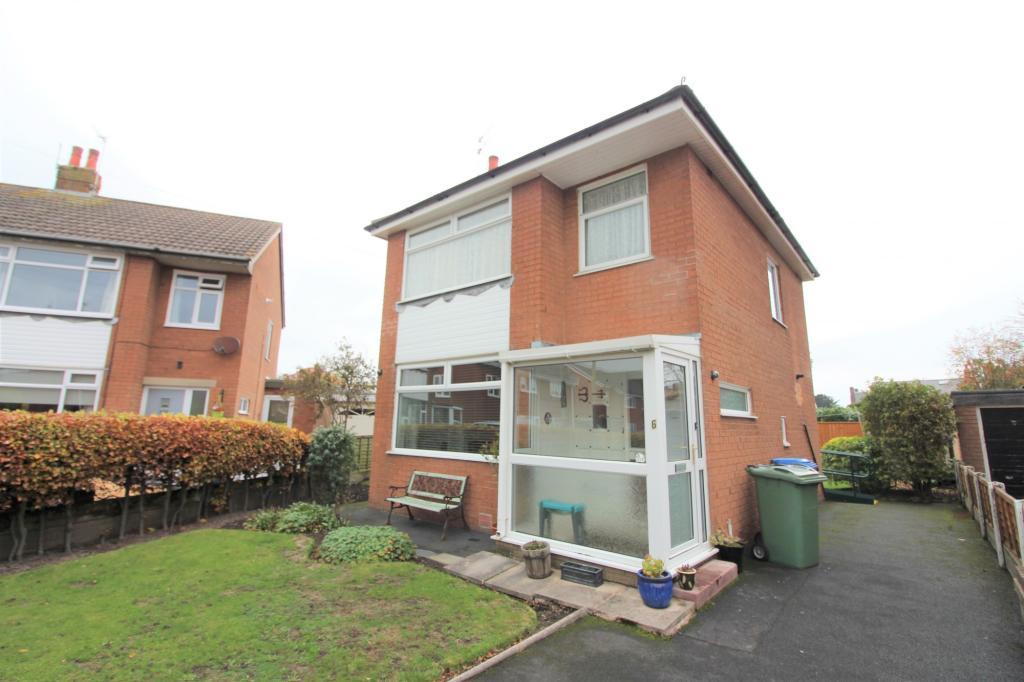
Was £310,000 (Jan 2022)
Now £285,000 (Dec 2025)
Price change -£25,000 over 3.9 yrs
Total % -8.1%
Annualised % ↓ 2.1%
Listing photo for 6 Allen Close No. 3

6 Allen Close

FY5 3NS · Semi-D · 3 bed

Was £148,000 (Oct 2020)
Now £135,000 (Jul 2025)
Price change -£13,000 over 4.7 yrs
Total % -8.8%
Annualised % ↓ 1.9%
Listing photo for 9 Birch Lane No. 4

9 Birch Lane

FY5 4GS · Semi-D

Was £204,495 (Apr 2018)
Now £185,000 (Nov 2025)
Price change -£19,495 over 7.6 yrs
Total % -9.5%
Annualised % ↓ 1.3%
Listing photo for 4 Hapton Street No. 5

4 Hapton Street

FY5 4JD · Terrace · 2 bed

Was £98,000 (Jul 2007)
Now £80,000 (Dec 2025)
Price change -£18,000 over 18.4 yrs
Total % -18.4%
Annualised % ↓ 1.1%
Listing photo for Flat 1 North Court, 302 - 304 North Drive No. 6

Flat 1 North Court, 302 - 304 North Drive

FY5 3RD · Flat · 1 bed

Was £76,000 (Feb 2006)
Now £62,500 (Jun 2025)
Price change -£13,500 over 19.3 yrs
Total % -17.8%
Annualised % ↓ 1.0%
Listing photo for 6 Rosemary Avenue No. 7

6 Rosemary Avenue

FY5 2RE · Detached · 2 bed

Was £327,500 (Nov 2022)
Now £317,500 (Feb 2026)
Price change -£10,000 over 3.2 yrs
Total % -3.0%
Annualised % ↓ 1.0%
Listing photo for 6 Kelso Avenue No. 8

6 Kelso Avenue

FY5 3EA · Semi-D · 3 bed

Was £200,000 (Mar 2023)
Now £195,000 (Oct 2025)
Price change -£5,000 over 2.7 yrs
Total % -2.5%
Annualised % ↓ 0.9%
Listing photo for Flat 12 Lodge Court Norbreck Road No. 9

Flat 12 Lodge Court Norbreck Road

FY5 1RE · Flat · 2 bed

Was £97,000 (Aug 2015)
Now £91,000 (Jun 2025)
Price change -£6,000 over 9.8 yrs
Total % -6.2%
Annualised % ↓ 0.7%
Listing photo for 4 Mill View No. 10

4 Mill View

FY5 3SP · Semi-D · 4 bed

Was £299,950 (Jun 2008)
Now £269,000 (Dec 2025)
Price change -£30,950 over 17.5 yrs
Total % -10.3%
Annualised % ↓ 0.6%
Listing photo for 161 Fleetwood Road South No. 11

161 Fleetwood Road South

FY5 5NS · Detached · 4 bed

Was £449,950 (Apr 2022)
Now £439,950 (Dec 2025)
Price change -£10,000 over 3.6 yrs
Total % -2.2%
Annualised % ↓ 0.6%
Listing photo for 109 Hawthorn Drive No. 12

109 Hawthorn Drive

FY5 4GQ · Flat · 1 bed

Was £89,950 (Aug 2021)
Now £87,950 (Jun 2025)
Price change -£2,000 over 3.9 yrs
Total % -2.2%
Annualised % ↓ 0.6%
Listing photo for 2 The Courtyard No. 13

2 The Courtyard

FY5 3FY · Terrace

Was £164,950 (Jul 2006)
Now £158,000 (Aug 2025)
Price change -£6,950 over 19.1 yrs
Total % -4.2%
Annualised % ↓ 0.2%
Listing photo for 1 Skylark Avenue No. 14

1 Skylark Avenue

FY5 3UZ · Semi-D

Was £207,950 (Dec 2021)
Now £207,000 (Sep 2025)
Price change -£950 over 3.8 yrs
Total % -0.5%
Annualised % ↓ 0.1%
Listing photo for 11 Pheasant Wood Drive No. 15

11 Pheasant Wood Drive

FY5 2AW · Semi-D · 3 bed

Was £138,000 (Apr 2006)
Now £136,000 (Jan 2026)
Price change -£2,000 over 19.7 yrs
Total % -1.5%
Annualised % ↓ 0.1%

Ladders — largest house price rises in FY5

The top-ranked FY5 properties with the biggest house price rises on resale. Go beyond house price indices with specific examples.

Listing photo for 35 Oxendale Road No. 1

35 Oxendale Road

FY5 4EH · Semi-D · 2 bed

Was £107,500 (Jul 2021)
Now £226,000 (Aug 2025)
Price change +£118,500 over 4.1 yrs
Total % 110.2%
Annualised % ↑ 20.1%
Listing photo for 106 Cleveleys Avenue No. 2

106 Cleveleys Avenue

FY5 2DZ · Semi-D · 3 bed

Was £117,000 (Sep 2022)
Now £184,000 (Jun 2025)
Price change +£67,000 over 2.8 yrs
Total % 57.3%
Annualised % ↑ 17.7%
Listing photo for 26 Alconbury Crescent No. 3

26 Alconbury Crescent

FY5 1DR · Terrace · 4 bed

Was £133,000 (Feb 2023)
Now £220,000 (Apr 2026)
Price change +£87,000 over 3.1 yrs
Total % 65.4%
Annualised % ↑ 17.4%
Listing photo for 28 Eversleigh Avenue No. 4

28 Eversleigh Avenue

FY5 2EN · Semi-D · 2 bed

Was £103,000 (Feb 2023)
Now £167,500 (Mar 2026)
Price change +£64,500 over 3.1 yrs
Total % 62.6%
Annualised % ↑ 17.2%
Listing photo for 1 Ipswich Place No. 5

1 Ipswich Place

FY5 1SP · Detached · 3 bed

Was £160,000 (Dec 2020)
Now £312,000 (Nov 2025)
Price change +£152,000 over 4.9 yrs
Total % 95.0%
Annualised % ↑ 14.5%
Listing photo for 3 The Square No. 6

3 The Square

FY5 1JR · Semi-D · 2 bed

Was £150,000 (Sep 2023)
Now £210,000 (Apr 2026)
Price change +£60,000 over 2.6 yrs
Total % 40.0%
Annualised % ↑ 14.0%
Listing photo for 40 Leicester Avenue No. 7

40 Leicester Avenue

FY5 2DL · Semi-D · 3 bed

Was £90,000 (Aug 2023)
Now £115,000 (Sep 2025)
Price change +£25,000 over 2.1 yrs
Total % 27.8%
Annualised % ↑ 12.4%
Listing photo for 6 Whitethorne Mews No. 8

6 Whitethorne Mews

FY5 5DT · Detached · 3 bed

Was £132,500 (Jul 2019)
Now £251,000 (Oct 2025)
Price change +£118,500 over 6.3 yrs
Total % 89.4%
Annualised % ↑ 10.7%
Listing photo for 2 Beach Road No. 9

2 Beach Road

FY5 1EF · Semi-D · 2 bed

Was £108,500 (Dec 2020)
Now £180,000 (Nov 2025)
Price change +£71,500 over 5.0 yrs
Total % 65.9%
Annualised % ↑ 10.7%
Listing photo for 32 Blythe Avenue No. 10

32 Blythe Avenue

FY5 2LL · Semi-D · 2 bed

Was £135,000 (Mar 2023)
Now £174,250 (Sep 2025)
Price change +£39,250 over 2.5 yrs
Total % 29.1%
Annualised % ↑ 10.5%
Listing photo for 42 North Drive No. 11

42 North Drive

FY5 3AQ · Semi-D · 3 bed

Was £150,000 (Oct 2020)
Now £249,000 (Dec 2025)
Price change +£99,000 over 5.1 yrs
Total % 66.0%
Annualised % ↑ 10.4%
Listing photo for 32 Denbigh Avenue No. 12

32 Denbigh Avenue

FY5 3PU · Semi-D · 2 bed

Was £153,000 (Jul 2021)
Now £233,000 (Dec 2025)
Price change +£80,000 over 4.4 yrs
Total % 52.3%
Annualised % ↑ 10.0%
Listing photo for 25 Fernwood Avenue No. 13

25 Fernwood Avenue

FY5 5EU · Semi-D · 2 bed

Was £120,000 (Mar 2021)
Now £190,000 (Jan 2026)
Price change +£70,000 over 4.8 yrs
Total % 58.3%
Annualised % ↑ 10.0%
Listing photo for 22 Kelverdale Road No. 14

22 Kelverdale Road

FY5 3DL · Semi-D · 2 bed

Was £112,000 (Feb 2020)
Now £188,000 (Aug 2025)
Price change +£76,000 over 5.5 yrs
Total % 67.9%
Annualised % ↑ 9.9%
Listing photo for 10 The Close No. 15

10 The Close

FY5 1JX · Semi-D · 2 bed

Was £140,000 (Apr 2019)
Now £250,000 (Nov 2025)
Price change +£110,000 over 6.6 yrs
Total % 78.6%
Annualised % ↑ 9.2%

Frequently asked questions

Each entry links sales by the address and property type from Land Registry, with two registered sales at least two years apart. The latest sale was in the last 12 months. Prices are nominal — not adjusted for extensions, condition, or inflation. We show listings with archived photos and floorplans where available (15 snakes, 15 ladders).

A fall is not always a market crash story. Land Registry data input errors, Lease or title changes, part ownership, mis-matched addresses can all influence the numbers. This is not analysis nor is it investment advice, just a bit of fun.

We link sales based on the address and property type provided by Land Registry. We then compare the latest sale to the immediately previous registered sale on that address.

Back to FY5 house price analysis