Property Snakes & Ladders in LL28
The biggest price drops and jumps on homes sold in the last year, compared with their previous Land Registry sale - curiosity, not analysis.
Rankings from Land Registry resales, last calculated 01 July 2026.
Snakes — biggest house price falls in LL28
The top-ranked LL28 properties with the largest house price falls on resale. Go beyond house price indices with specific examples.
 No. 1
No. 1
Flat 3 Penrhyn Park Penrhyn Avenue
LL28 4PL · Flat · 1 bed
 No. 2
No. 2
Apartment 45 Adlington House Abbey Road
LL28 4PU · Flat · 3 bed
 No. 3
No. 3
Apartment 24 Adlington House Abbey Road
LL28 4PU · Flat · 2 bed
 No. 4
No. 4
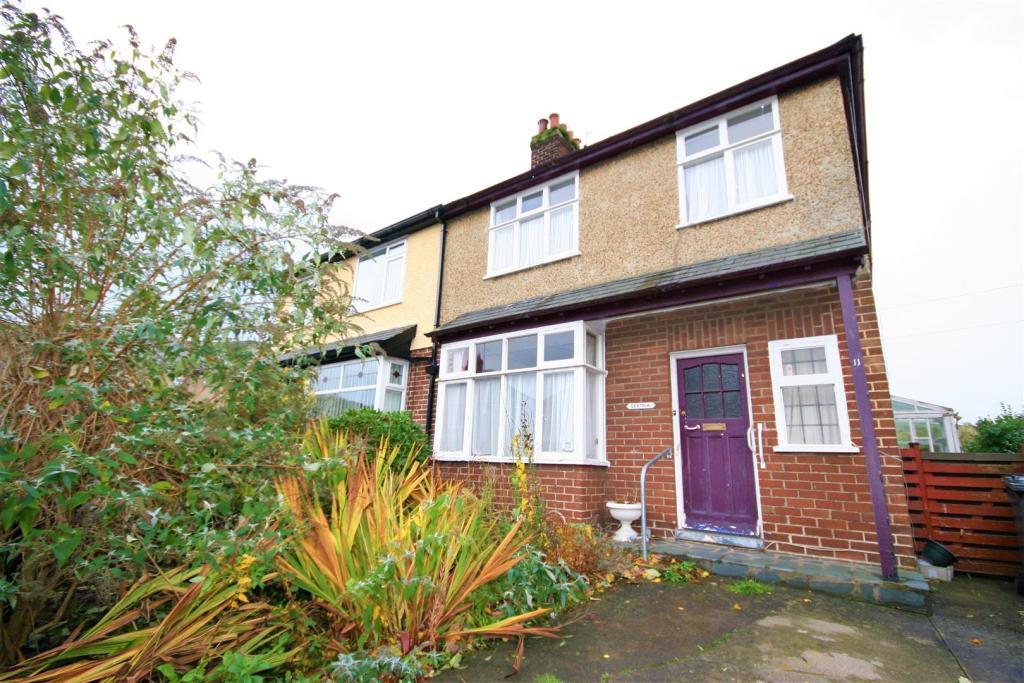
11 Marine View
LL28 4PQ · Semi-D · 3 bed
 No. 5
No. 5
26 Nant Yr Efail
LL28 5DR · Semi-D · 3 bed
Ladders — largest house price rises in LL28
The top-ranked LL28 properties with the biggest house price rises on resale. Go beyond house price indices with specific examples.
 No. 1
No. 1
86 Abbey Road
LL28 4PF · Detached · 4 bed
 No. 2
No. 2
11 Bryn Marl Road
LL28 5DT · Semi-D · 3 bed
 No. 3
No. 3
55 Cayley Promenade
LL28 4EP · Detached · 7 bed
 No. 4
No. 4
28a Francis Avenue
LL28 4DW · Flat
 No. 5
No. 5
24 Bryn Marl Road
LL28 5EA · Semi-D · 3 bed
 No. 6
No. 6
Apartment 10 Westbury West Promenade
LL28 4BY · Flat · 2 bed
 No. 7
No. 7
10 Holbeck Road
LL28 4EA · Detached · 6 bed
 No. 8
No. 8
15 Ffordd Triban
LL28 5YY · Detached · 4 bed
 No. 9
No. 9
Bryn Seion Cherry Tree Lane
LL28 5YH · Detached · 3 bed
 No. 10
37 Cayley Promenade
LL28 4DU · Detached
 No. 11
61 Llannerch Road West
LL28 4AS · Semi-D · 4 bed
 No. 12
14 Church Drive
LL28 4PB · Semi-D · 4 bed
 No. 13
Ael Y Bryn
LL28 5TW · Semi-D · 3 bed
 No. 14
95 Dinerth Road
LL28 4YF · Detached · 3 bed
 No. 15
4 Tyn Y Celyn
LL28 5NN · Detached · 3 bed