Property Snakes & Ladders in CH5 3
The biggest price drops and jumps on homes sold in the last year, compared with their previous Land Registry sale - curiosity, not analysis.
Rankings from Land Registry resales, last calculated 01 July 2026.
Ladders — largest house price rises in CH5 3
The top-ranked CH5 3 properties with the biggest house price rises on resale. Go beyond house price indices with specific examples.
 No. 1
No. 1
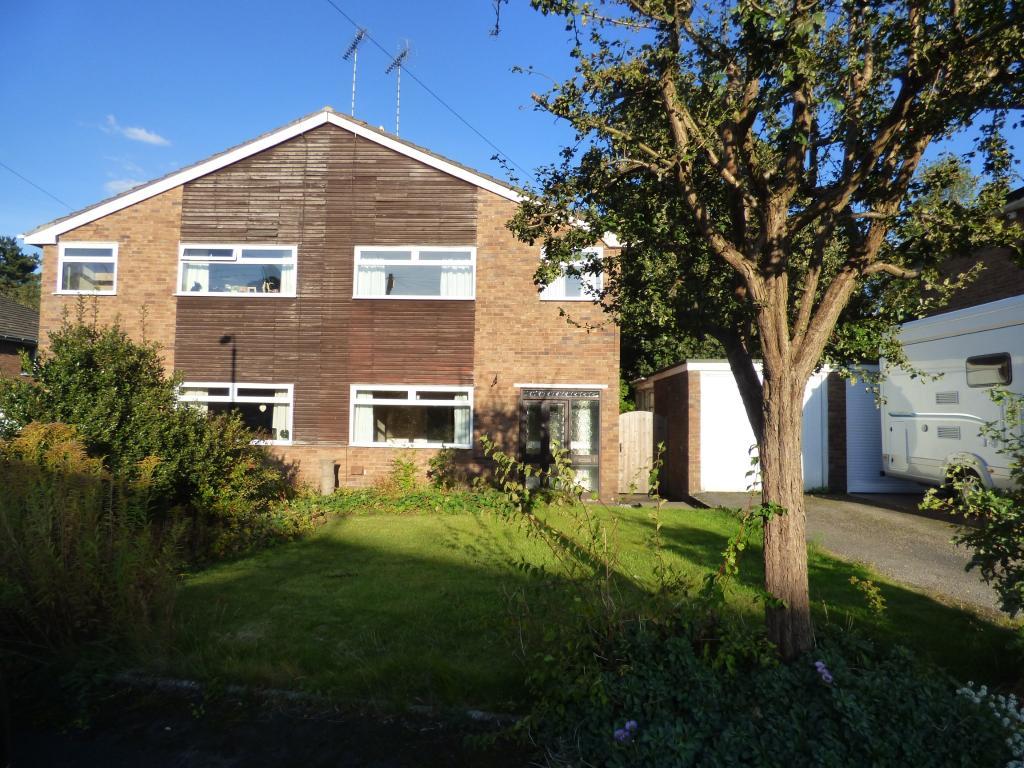
9 Blackbrook Avenue
CH5 3HJ · Detached · 4 bed
Was
£295,000 (May 2022)
Now
£620,000 (Nov 2025)
Price change
+£325,000 over 3.5 yrs
Total %
110.2%
Annualised %
↑ 23.8%
 No. 2
No. 2
7 Chestnut Crescent
CH5 3NT · Detached · 4 bed
Was
£265,000 (Jan 2021)
Now
£425,000 (Mar 2026)
Price change
+£160,000 over 5.1 yrs
Total %
60.4%
Annualised %
↑ 9.7%
 No. 3
No. 3
28 Wold Court
CH5 3LN · Semi-D · 3 bed
Was
£220,000 (Jun 2021)
Now
£300,000 (Oct 2025)
Price change
+£80,000 over 4.4 yrs
Total %
36.4%
Annualised %
↑ 7.3%
 No. 4
No. 4
19 Park Avenue
CH5 3HY · Detached · 3 bed
Was
£350,000 (May 2023)
Now
£420,000 (Apr 2026)
Price change
+£70,000 over 2.9 yrs
Total %
20.0%
Annualised %
↑ 6.5%
 No. 5
No. 5
27 Lower Aston Hall Lane
CH5 3EX · Semi-D
Was
£290,000 (Mar 2021)
Now
£380,000 (Apr 2026)
Price change
+£90,000 over 5.1 yrs
Total %
31.0%
Annualised %
↑ 5.4%
 No. 6
No. 6
3 Brunswood Green
CH5 3JA · Semi-D · 3 bed
Was
£39,500 (Sep 1997)
Now
£175,000 (Apr 2026)
Price change
+£135,500 over 28.6 yrs
Total %
343.0%
Annualised %
↑ 5.3%
 No. 7
No. 7
1 Brook Lane
CH5 3PR · Semi-D · 3 bed
Was
£155,000 (Jun 2019)
Now
£217,500 (Apr 2026)
Price change
+£62,500 over 6.8 yrs
Total %
40.3%
Annualised %
↑ 5.1%
 No. 8
No. 8
6 St Davids Close
CH5 3AP · Semi-D · 2 bed
Was
£170,000 (Mar 2019)
Now
£230,000 (Oct 2025)
Price change
+£60,000 over 6.6 yrs
Total %
35.3%
Annualised %
↑ 4.7%
 No. 9
No. 9
16 Moorfield Road
CH5 3EZ · Detached · 3 bed
Was
£78,500 (Sep 2001)
Now
£230,000 (Feb 2026)
Price change
+£151,500 over 24.5 yrs
Total %
193.0%
Annualised %
↑ 4.5%
 No. 10
8 Maes Glas
CH5 3GE · Semi-D · 4 bed
Was
£139,000 (Aug 2001)
Now
£400,000 (Oct 2025)
Price change
+£261,000 over 24.1 yrs
Total %
187.8%
Annualised %
↑ 4.5%
 No. 11
7 Grant Drive
CH5 3RR · Semi-D · 4 bed
Was
£180,000 (Aug 2015)
Now
£275,000 (Aug 2025)
Price change
+£95,000 over 10.0 yrs
Total %
52.8%
Annualised %
↑ 4.3%
 No. 12
8 Chaucer Close
CH5 3TU · Detached · 4 bed
Was
£112,500 (May 1996)
Now
£397,500 (Mar 2026)
Price change
+£285,000 over 29.8 yrs
Total %
253.3%
Annualised %
↑ 4.3%
 No. 13
Rainbows End Level Road
CH5 3JR · Detached · 4 bed
Was
£287,500 (Dec 2016)
Now
£420,000 (Nov 2025)
Price change
+£132,500 over 8.9 yrs
Total %
46.1%
Annualised %
↑ 4.3%
 No. 14
7 Llys Brenig
CH5 3UB · Detached · 3 bed
Was
£177,500 (Apr 2017)
Now
£255,000 (Apr 2026)
Price change
+£77,500 over 9.0 yrs
Total %
43.7%
Annualised %
↑ 4.1%
 No. 15
54 Sheridan Avenue
CH5 3UN · Terrace
Was
£200,000 (Jan 2021)
Now
£240,000 (Oct 2025)
Price change
+£40,000 over 4.7 yrs
Total %
20.0%
Annualised %
↑ 4.0%
Frequently asked questions
Each entry links sales by the address and property type from Land Registry, with two registered sales at least two years apart.
The latest sale was in the last 12 months. Prices are nominal — not adjusted for extensions, condition, or inflation.
We show listings with archived photos and floorplans where available (15 snakes, 15 ladders).
A fall is not always a market crash story. Land Registry data input errors, Lease or title changes, part ownership, mis-matched addresses can all influence the numbers.
This is not analysis nor is it investment advice, just a bit of fun.
We link sales based on the address and property type provided by Land Registry. We then compare the latest sale to the immediately previous registered sale on that address.