Property Snakes & Ladders in M8 4
The biggest price drops and jumps on homes sold in the last year, compared with their previous Land Registry sale - curiosity, not analysis.
Rankings from Land Registry resales, last calculated 01 July 2026.
Snakes — biggest house price falls in M8 4
The top-ranked M8 4 properties with the largest house price falls on resale. Go beyond house price indices with specific examples.
 No. 1
No. 1
30 Chudleigh Road
M8 4FR · Semi-D
 No. 2
No. 2
Flat 44 Carmel Court, 14 Holland Road
M8 4NP · Flat · 1 bed
 No. 3
No. 3
Apartment 10 14 Delaunays Road
M8 4QS · Flat · 2 bed
Ladders — largest house price rises in M8 4
The top-ranked M8 4 properties with the biggest house price rises on resale. Go beyond house price indices with specific examples.
 No. 1
No. 1
106 Chudleigh Road
M8 4PG · Terrace · 2 bed
 No. 2
No. 2
Apartment 8 14 Delaunays Road
M8 4QS · Flat · 2 bed
 No. 3
No. 3
12 Edson Road
M8 4WF · Semi-D · 3 bed
 No. 4
No. 4
48 Chudleigh Road
M8 4PG · Terrace · 2 bed
 No. 5
No. 5
6 Birwood Road
M8 4GL · Terrace · 3 bed
 No. 6
No. 6
12 Haversham Road
M8 4JB · Semi-D · 3 bed
 No. 7
No. 7
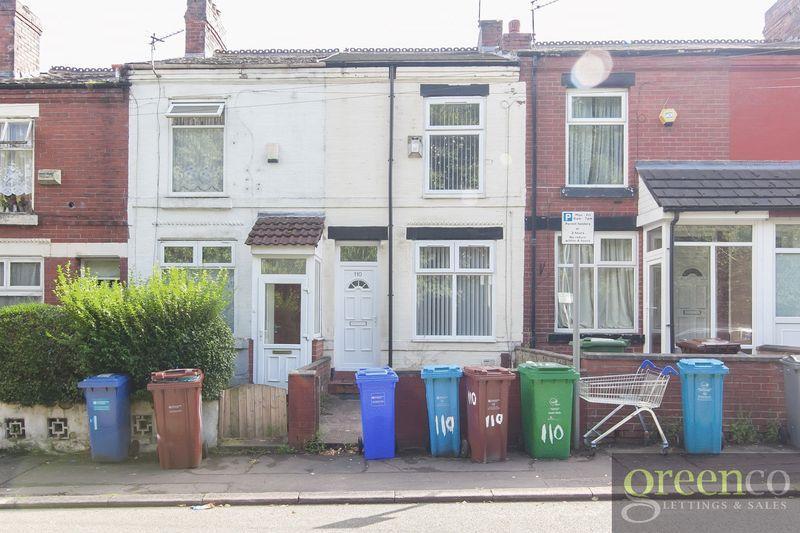
110 Cleveland Road
M8 4QY · Terrace · 2 bed
 No. 8
No. 8
2 Dales Avenue
M8 4NU · Semi-D · 3 bed
 No. 9
No. 9
78 Meade Hill Road
M8 4LP · Semi-D · 4 bed
 No. 10
51 Herristone Road
M8 4PL · Terrace · 2 bed
 No. 11
27 Stanhorne Avenue
M8 4PQ · Terrace · 2 bed
 No. 12
38 Givendale Drive
M8 4PZ · Semi-D · 1 bed
 No. 13
114 Kearsley Road
M8 4GJ · Terrace · 2 bed
 No. 14
22 Kathkin Avenue
M8 4QL · Terrace · 3 bed
 No. 15
20 Edilom Road
M8 4HZ · Semi-D · 3 bed