Property Snakes & Ladders in NE37 2
The biggest price drops and jumps on homes sold in the last year, compared with their previous Land Registry sale - curiosity, not analysis.
Rankings from Land Registry resales, last calculated 01 July 2026.
Snakes — biggest house price falls in NE37 2
The top-ranked NE37 2 properties with the largest house price falls on resale. Go beyond house price indices with specific examples.
 No. 1
No. 1
2 Wharfedale Avenue
NE37 2JX · Semi-D · 3 bed
Ladders — largest house price rises in NE37 2
The top-ranked NE37 2 properties with the biggest house price rises on resale. Go beyond house price indices with specific examples.
 No. 1
No. 1
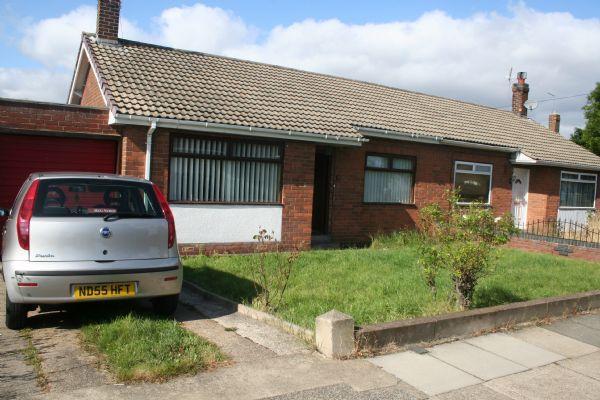
5 Monterey
NE37 2RG · Detached · 2 bed
 No. 2
No. 2
10 Garsdale Avenue
NE37 2JZ · Semi-D · 3 bed
 No. 3
No. 3
15 Raydale Avenue
NE37 2JY · Semi-D · 3 bed
 No. 4
No. 4
538 Coach Road Estate
NE37 2HW · Semi-D · 2 bed
 No. 5
No. 5
66 Hollin Hill Road
NE37 2DW · Semi-D · 3 bed
 No. 6
No. 6
29 Coach Road Estate
NE37 2EJ · Semi-D · 2 bed
 No. 7
No. 7
36 Urban Gardens
NE37 2DD · Semi-D · 3 bed
 No. 8
No. 8
3 Hampshire Place
NE37 2NP · Semi-D · 2 bed
 No. 9
No. 9
67 Manor Park
NE37 2BS · Semi-D · 3 bed
 No. 10
127 Spout Lane
NE37 2UD · Terrace · 3 bed
 No. 11
491 Coach Road Estate
NE37 2HL · Semi-D · 3 bed
 No. 12
41 Laurens Court
NE37 2EE · Terrace · 3 bed
 No. 13
267 Coach Road Estate
NE37 2EX · Terrace · 3 bed
 No. 14
324 Coach Road Estate
NE37 2HA · Semi-D · 3 bed
 No. 15
7 Essex Drive
NE37 2ND · Terrace · 3 bed