Property Snakes & Ladders in NN15 7

The biggest price drops and jumps on homes sold in the last year, compared with their previous Land Registry sale - curiosity, not analysis.

Rankings from Land Registry resales, last calculated 05 June 2026.

Explore another area

Snakes — biggest house price falls in NN15 7

The top-ranked NN15 7 properties with the largest house price falls on resale. Go beyond house price indices with specific examples.
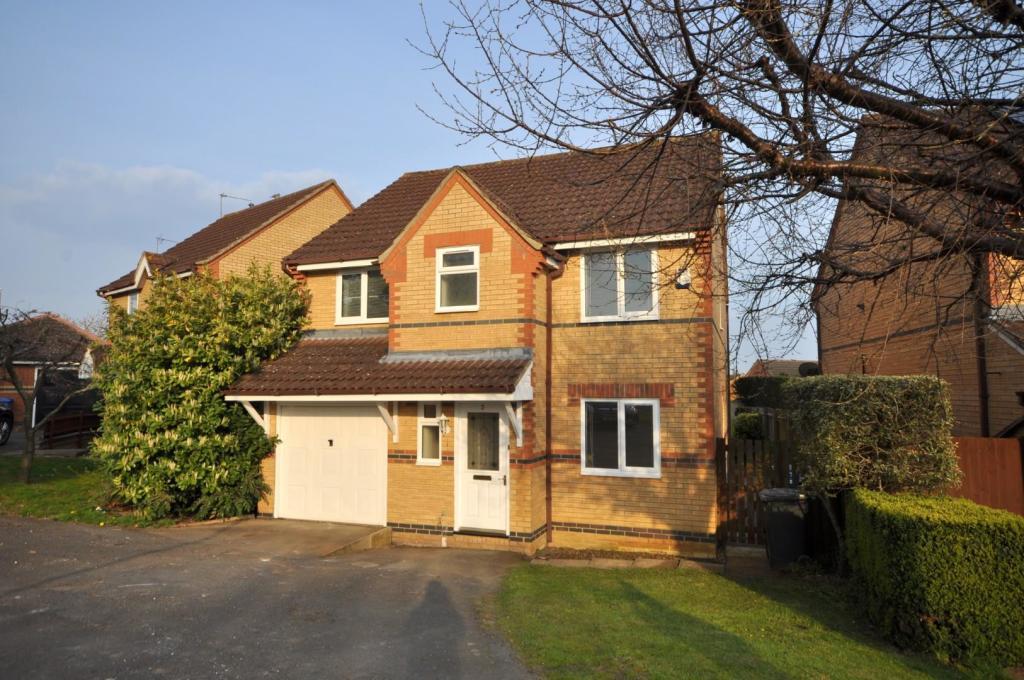
Listing photo for 14 Westhill Drive No. 1

14 Westhill Drive

NN15 7LG · Detached · 3 bed

Was £330,000 (Dec 2018)
Now £300,000 (Aug 2025)
Price change -£30,000 over 6.7 yrs
Total % -9.1%
Annualised % ↓ 1.4%

Ladders — largest house price rises in NN15 7

The top-ranked NN15 7 properties with the biggest house price rises on resale. Go beyond house price indices with specific examples.

Listing photo for 11 Larch Road No. 1

11 Larch Road

NN15 7BH · Semi-D · 3 bed

Was £150,000 (Jul 2019)
Now £256,000 (Jul 2025)
Price change +£106,000 over 6.1 yrs
Total % 70.7%
Annualised % ↑ 9.2%
Listing photo for 11 Brockhill Close No. 2

11 Brockhill Close

NN15 7DS · Semi-D · 2 bed

Was £158,000 (Mar 2020)
Now £245,000 (Mar 2026)
Price change +£87,000 over 6.0 yrs
Total % 55.1%
Annualised % ↑ 7.5%
Listing photo for 81 Hawthorn Road No. 3

81 Hawthorn Road

NN15 7HT · Terrace · 3 bed

Was £65,000 (Sep 2000)
Now £302,000 (Jul 2025)
Price change +£237,000 over 24.8 yrs
Total % 364.6%
Annualised % ↑ 6.4%
Listing photo for 281 Windmill Avenue No. 4

281 Windmill Avenue

NN15 7EB · Detached

Was £93,500 (Jul 1997)
Now £420,000 (Aug 2025)
Price change +£326,500 over 28.1 yrs
Total % 349.2%
Annualised % ↑ 5.5%
Listing photo for 31 Moorhouse Way No. 5

31 Moorhouse Way

NN15 7LX · Detached · 4 bed

Was £270,000 (Feb 2015)
Now £460,000 (Aug 2025)
Price change +£190,000 over 10.5 yrs
Total % 70.4%
Annualised % ↑ 5.2%
Listing photo for 28 Chestnut Avenue No. 6

28 Chestnut Avenue

NN15 7BG · Semi-D · 3 bed

Was £44,000 (May 1995)
Now £201,500 (Jun 2025)
Price change +£157,500 over 30.1 yrs
Total % 357.9%
Annualised % ↑ 5.2%
Listing photo for 3 Boardman Road No. 7

3 Boardman Road

NN15 7DH · Detached · 4 bed

Was £158,000 (Nov 2012)
Now £300,000 (Aug 2025)
Price change +£142,000 over 12.7 yrs
Total % 89.9%
Annualised % ↑ 5.2%
Listing photo for 17 Elm Road No. 8

17 Elm Road

NN15 7AX · Semi-D · 3 bed

Was £97,000 (Mar 2010)
Now £202,000 (Jul 2025)
Price change +£105,000 over 15.4 yrs
Total % 108.2%
Annualised % ↑ 4.9%
Listing photo for 11 Wilkie Close No. 9

11 Wilkie Close

NN15 7RD · Detached · 4 bed

Was £124,995 (Nov 1999)
Now £390,000 (Sep 2025)
Price change +£265,005 over 25.8 yrs
Total % 212.0%
Annualised % ↑ 4.5%
Listing photo for 7 Torville Crescent No. 10

7 Torville Crescent

NN15 7EN · Detached · 3 bed

Was £165,000 (Aug 2012)
Now £293,000 (Sep 2025)
Price change +£128,000 over 13.1 yrs
Total % 77.6%
Annualised % ↑ 4.5%
Listing photo for 8 Southlands No. 11

8 Southlands

NN15 7QG · Detached

Was £148,000 (Sep 2000)
Now £440,000 (Sep 2025)
Price change +£292,000 over 25.0 yrs
Total % 197.3%
Annualised % ↑ 4.5%
Listing photo for 18 Christie Way No. 12

18 Christie Way

NN15 7EL · Detached · 4 bed

Was £210,000 (Jun 2013)
Now £347,000 (Sep 2025)
Price change +£137,000 over 12.2 yrs
Total % 65.2%
Annualised % ↑ 4.2%
Listing photo for 31 Deeble Road No. 13

31 Deeble Road

NN15 7AB · Detached · 3 bed

Was £177,000 (Sep 2015)
Now £266,000 (Feb 2026)
Price change +£89,000 over 10.4 yrs
Total % 50.3%
Annualised % ↑ 4.0%
Listing photo for 59 St Marys Road No. 14

59 St Marys Road

NN15 7BP · Detached · 3 bed

Was £235,000 (Sep 2012)
Now £367,500 (Jun 2025)
Price change +£132,500 over 12.7 yrs
Total % 56.4%
Annualised % ↑ 3.6%
Listing photo for 5 Hemery Way No. 15

5 Hemery Way

NN15 7RN · Detached · 3 bed

Was £166,750 (Oct 2006)
Now £310,000 (Jul 2025)
Price change +£143,250 over 18.8 yrs
Total % 85.9%
Annualised % ↑ 3.4%

Frequently asked questions

Each entry links sales by the address and property type from Land Registry, with two registered sales at least two years apart. The latest sale was in the last 12 months. Prices are nominal — not adjusted for extensions, condition, or inflation. We show listings with archived photos and floorplans where available (15 snakes, 15 ladders).

A fall is not always a market crash story. Land Registry data input errors, Lease or title changes, part ownership, mis-matched addresses can all influence the numbers. This is not analysis nor is it investment advice, just a bit of fun.

We link sales based on the address and property type provided by Land Registry. We then compare the latest sale to the immediately previous registered sale on that address.

Back to NN15 7 house price analysis