Property Snakes & Ladders in PR1 5
The biggest price drops and jumps on homes sold in the last year, compared with their previous Land Registry sale - curiosity, not analysis.
Rankings from Land Registry resales, last calculated 01 July 2026.
Snakes — biggest house price falls in PR1 5
The top-ranked PR1 5 properties with the largest house price falls on resale. Go beyond house price indices with specific examples.
 No. 1
No. 1
88 Miller Road
PR1 5QS · Terrace · 3 bed
 No. 2
No. 2
Apartment 142 Centenary Mill Court New Hall Lane
PR1 5JH · Flat · 2 bed
Ladders — largest house price rises in PR1 5
The top-ranked PR1 5 properties with the biggest house price rises on resale. Go beyond house price indices with specific examples.
 No. 1
No. 1
20 Isherwood Street
PR1 5HP · Terrace · 2 bed
 No. 2
No. 2
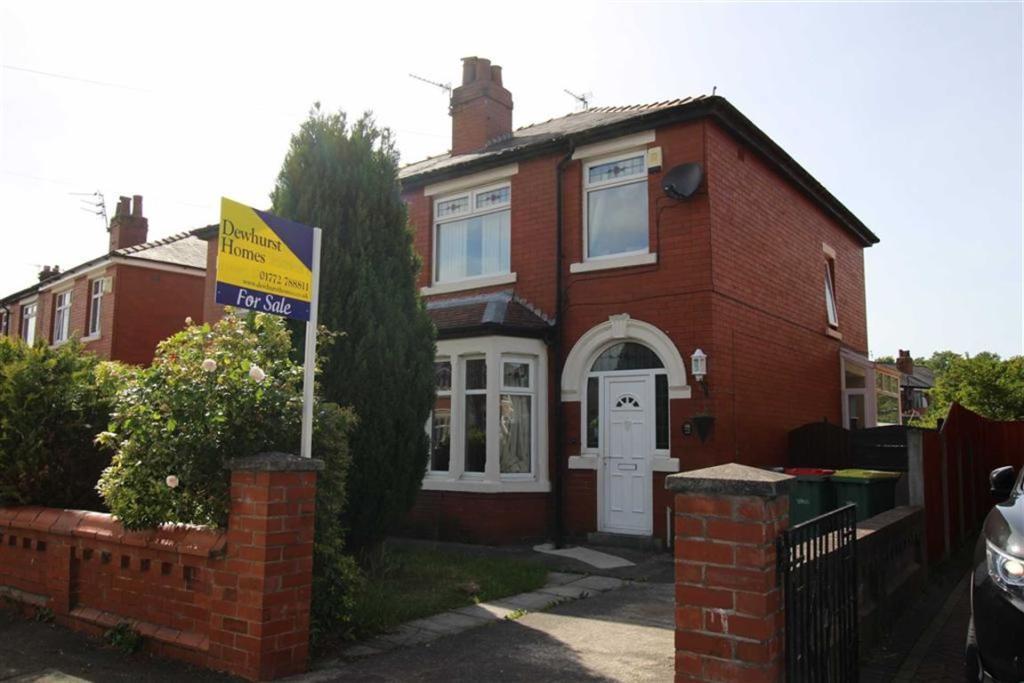
35 Lutwidge Avenue
PR1 5HS · Semi-D · 2 bed
 No. 3
No. 3
274 Fletcher Road
PR1 5HJ · Terrace · 2 bed
 No. 4
No. 4
12 Orrest Road
PR1 5TT · Semi-D · 3 bed
 No. 5
No. 5
8 Glenluce Drive
PR1 5TB · Semi-D · 3 bed
 No. 6
No. 6
85 Dodgson Road
PR1 5HN · Terrace · 3 bed
 No. 7
No. 7
40 Chester Road
PR1 5HR · Terrace · 2 bed
 No. 8
No. 8
22 Tudor Avenue
PR1 5TH · Semi-D · 3 bed
 No. 9
No. 9
31 Curwen Street
PR1 5HY · Terrace · 3 bed
 No. 10
1 Ansdell Street
PR1 5ES · Terrace · 2 bed
 No. 11
33 Calverley Street
PR1 5YN · Terrace · 3 bed
 No. 12
35 Gaythorne Avenue
PR1 5SY · Semi-D · 3 bed
 No. 13
21 Gaythorne Avenue
PR1 5SY · Semi-D · 3 bed
 No. 14
65 Tudor Avenue
PR1 5TH · Semi-D · 4 bed
 No. 15
18 Merrick Avenue
PR1 5TL · Semi-D · 3 bed