Property Snakes & Ladders in SE9 5
The biggest price drops and jumps on homes sold in the last year, compared with their previous Land Registry sale - curiosity, not analysis.
Rankings from Land Registry resales, last calculated 01 July 2026.
Snakes — biggest house price falls in SE9 5
The top-ranked SE9 5 properties with the largest house price falls on resale. Go beyond house price indices with specific examples.
 No. 1
No. 1
Apartment 28 3 Grove Place
SE9 5AN · Flat
 No. 2
No. 2
Flat 6 101 Eltham Hill
SE9 5SU · Flat · 1 bed
Ladders — largest house price rises in SE9 5
The top-ranked SE9 5 properties with the biggest house price rises on resale. Go beyond house price indices with specific examples.
 No. 1
No. 1
9 Messeter Place
SE9 5DP · Terrace · 3 bed
 No. 2
No. 2
61 The Vista
SE9 5RE · Semi-D · 3 bed
 No. 3
No. 3
170 Gregory Crescent
SE9 5RT · Flat · 3 bed
 No. 4
No. 4
22 Cedarhurst Drive
SE9 5LP · Detached · 3 bed
 No. 5
No. 5
19 Woodmere
SE9 5NT · Terrace · 3 bed
 No. 6
No. 6
243 Kingsground
SE9 5ET · Terrace · 3 bed
 No. 7
No. 7
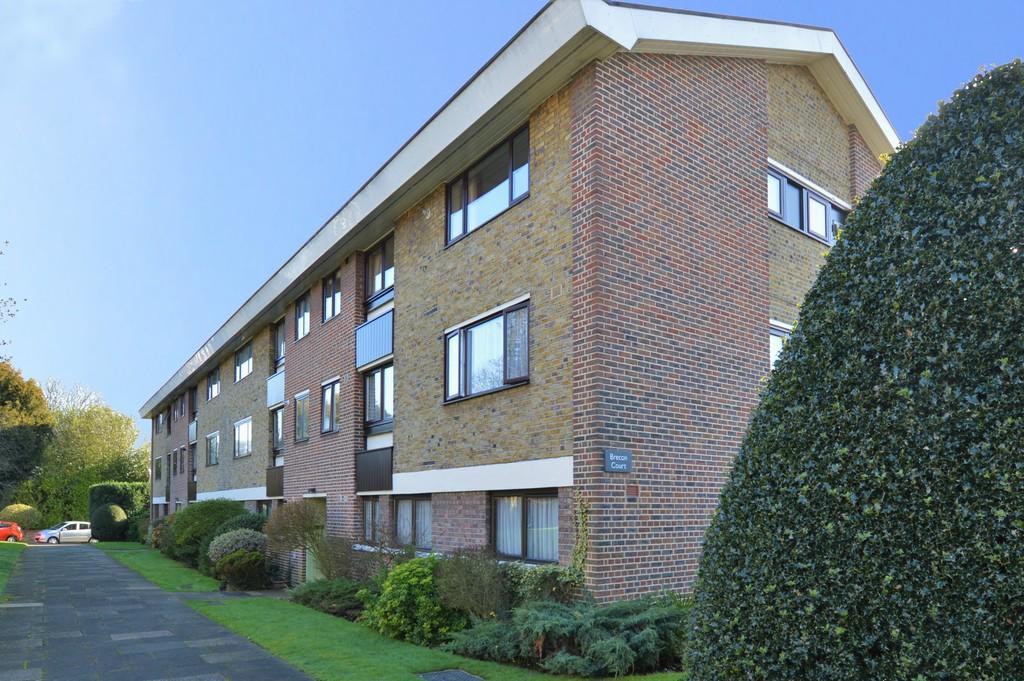
Flat 7 Brecon Court Greenacres
SE9 5BG · Flat · 2 bed
 No. 8
No. 8
99 Gregory Crescent
SE9 5RU · Semi-D · 3 bed
 No. 9
No. 9
116 Tarnwood Park
SE9 5PE · Flat · 3 bed
 No. 10
150 Eltham Palace Road
SE9 5LY · Terrace · 3 bed
 No. 11
128 Churchbury Road
SE9 5HZ · Terrace · 3 bed
 No. 12
9 Campfield Road
SE9 5JF · Flat · 2 bed
 No. 13
89 Eltham Hill
SE9 5SU · Semi-D · 3 bed
 No. 14
Flat 2 Fairlands Court North Park
SE9 5BH · Flat · 2 bed
 No. 15
9 Churchbury Road
SE9 5HU · Flat · 3 bed