Property Snakes & Ladders in ME15

The biggest price drops and jumps on homes sold in the last year, compared with their previous Land Registry sale - curiosity, not analysis.

Rankings from Land Registry resales, last calculated 05 June 2026.

Explore another area

Snakes — biggest house price falls in ME15

The top-ranked ME15 properties with the largest house price falls on resale. Go beyond house price indices with specific examples.

Listing photo for 9 Neath Court No. 1

9 Neath Court

ME15 7JS · Flat · 1 bed

Was £155,000 (Mar 2023)
Now £100,000 (Dec 2025)
Price change -£55,000 over 2.7 yrs
Total % -35.5%
Annualised % ↓ 14.8%
Listing photo for 12 Stafford Gardens No. 2

12 Stafford Gardens

ME15 6GZ · Flat · 1 bed

Was £85,000 (Jun 2022)
Now £77,500 (Sep 2025)
Price change -£7,500 over 3.2 yrs
Total % -8.8%
Annualised % ↓ 2.8%
Listing photo for 449 Paygate Sutton Road No. 3

449 Paygate Sutton Road

ME15 8RB · Flat · 3 bed

Was £380,000 (Nov 2023)
Now £362,000 (Jan 2026)
Price change -£18,000 over 2.2 yrs
Total % -4.7%
Annualised % ↓ 2.2%
Listing photo for 11 Rockwell Court No. 4

11 Rockwell Court

ME15 6EQ · Flat · 2 bed

Was £218,000 (Jul 2022)
Now £205,000 (Aug 2025)
Price change -£13,000 over 3.0 yrs
Total % -6.0%
Annualised % ↓ 2.0%
Listing photo for 22 Longham Copse No. 5

22 Longham Copse

ME15 8TL · Semi-D · 2 bed

Was £340,000 (Oct 2022)
Now £325,000 (Sep 2025)
Price change -£15,000 over 2.9 yrs
Total % -4.4%
Annualised % ↓ 1.6%
Listing photo for 11 Albion House Wharfdale Square No. 6

11 Albion House Wharfdale Square

ME15 6BF · Flat · 2 bed

Was £190,000 (Nov 2021)
Now £180,000 (Jun 2025)
Price change -£10,000 over 3.6 yrs
Total % -5.3%
Annualised % ↓ 1.5%
Listing photo for 1 Keble Place No. 7

1 Keble Place

ME15 9ZP · Terrace

Was £367,500 (Sep 2022)
Now £355,000 (Dec 2025)
Price change -£12,500 over 3.2 yrs
Total % -3.4%
Annualised % ↓ 1.1%
Listing photo for 10 Orchard Close No. 8

10 Orchard Close

ME15 6NU · Flat · 2 bed

Was £180,000 (May 2019)
Now £171,000 (Nov 2025)
Price change -£9,000 over 6.4 yrs
Total % -5.0%
Annualised % ↓ 0.8%
Listing photo for 22 Bramley Crescent No. 9

22 Bramley Crescent

ME15 8LA · Semi-D · 2 bed

Was £360,000 (Dec 2021)
Now £350,000 (Jan 2026)
Price change -£10,000 over 4.0 yrs
Total % -2.8%
Annualised % ↓ 0.7%
Listing photo for 124 Kingsley Road No. 10

124 Kingsley Road

ME15 7UL · Terrace · 3 bed

Was £310,000 (Apr 2022)
Now £305,000 (Aug 2025)
Price change -£5,000 over 3.4 yrs
Total % -1.6%
Annualised % ↓ 0.5%
Listing photo for 2 Halden Close No. 11

2 Halden Close

ME15 8SX · Semi-D · 2 bed
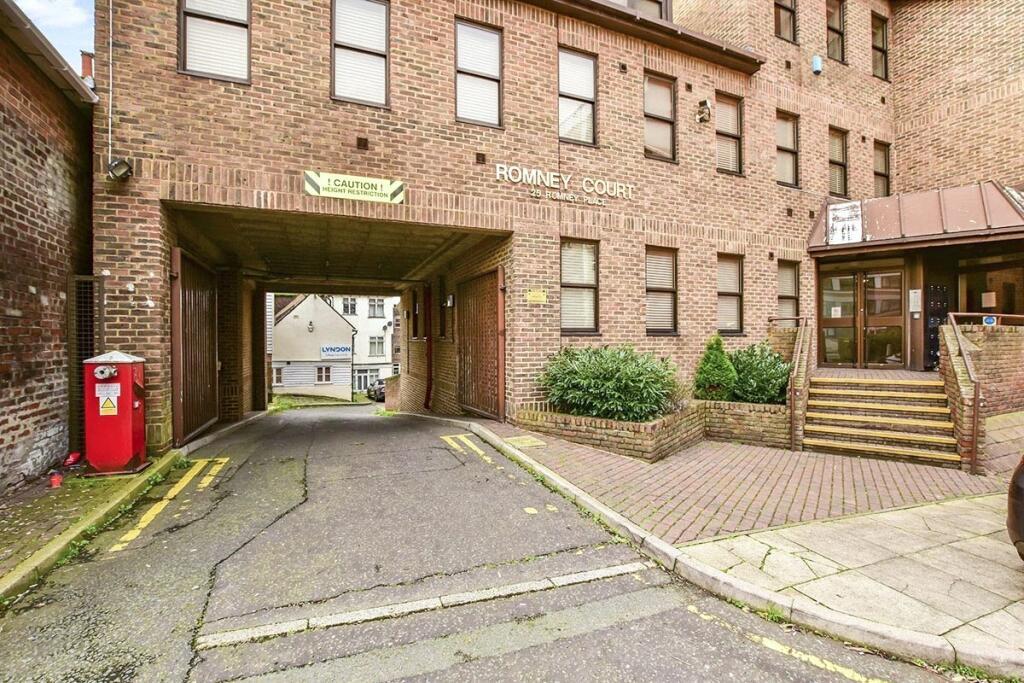
Was £315,000 (Jun 2022)
Now £310,000 (Mar 2026)
Price change -£5,000 over 3.8 yrs
Total % -1.6%
Annualised % ↓ 0.4%
Listing photo for 6 Greensands Road No. 12

6 Greensands Road

ME15 8NY · Semi-D · 3 bed

Was £390,000 (Aug 2022)
Now £385,000 (Nov 2025)
Price change -£5,000 over 3.2 yrs
Total % -1.3%
Annualised % ↓ 0.4%
Listing photo for Flat 9 Romney Court, 25 Romney Place No. 13

Flat 9 Romney Court, 25 Romney Place

ME15 6LG · Flat

Was £135,000 (Jun 2015)
Now £130,000 (Jan 2026)
Price change -£5,000 over 10.6 yrs
Total % -3.7%
Annualised % ↓ 0.4%
Listing photo for 56 Cornhill Place No. 14

56 Cornhill Place

ME15 6GX · Flat · 2 bed

Was £295,000 (Sep 2015)
Now £290,000 (Sep 2025)
Price change -£5,000 over 10.0 yrs
Total % -1.7%
Annualised % ↓ 0.2%
Listing photo for Whispering Waters High Banks No. 15

Whispering Waters High Banks

ME15 0EG · Detached · 4 bed

Was £665,000 (Aug 2022)
Now £663,000 (Jun 2025)
Price change -£2,000 over 2.8 yrs
Total % -0.3%
Annualised % ↓ 0.1%

Ladders — largest house price rises in ME15

The top-ranked ME15 properties with the biggest house price rises on resale. Go beyond house price indices with specific examples.

Listing photo for 2 Mote Bungalows No. 1

2 Mote Bungalows

ME15 8NQ · Terrace · 1 bed

Was £153,000 (Mar 2024)
Now £220,000 (Apr 2026)
Price change +£67,000 over 2.1 yrs
Total % 43.8%
Annualised % ↑ 19.0%
Listing photo for Hazel Cottage, 70a Linton Road No. 2

Hazel Cottage, 70a Linton Road

ME15 0AT · Detached · 3 bed

Was £250,000 (Nov 2021)
Now £390,000 (Aug 2025)
Price change +£140,000 over 3.7 yrs
Total % 56.0%
Annualised % ↑ 12.6%
Listing photo for 1 Upper Crisbrook Cottages Cave Hill No. 3

1 Upper Crisbrook Cottages Cave Hill

ME15 6DU · Semi-D · 3 bed

Was £220,000 (Jan 2018)
Now £500,000 (Aug 2025)
Price change +£280,000 over 7.6 yrs
Total % 127.3%
Annualised % ↑ 11.5%
Listing photo for 27 Elm Grove No. 4

27 Elm Grove

ME15 7RT · Semi-D · 3 bed

Was £300,000 (Apr 2021)
Now £475,000 (Aug 2025)
Price change +£175,000 over 4.3 yrs
Total % 58.3%
Annualised % ↑ 11.2%
Listing photo for 30 Church Street No. 5

30 Church Street

ME15 6RB · Semi-D

Was £450,000 (Aug 2022)
Now £610,000 (Sep 2025)
Price change +£160,000 over 3.1 yrs
Total % 35.6%
Annualised % ↑ 10.3%
Listing photo for 21 Hughenden Reach No. 6

21 Hughenden Reach

ME15 6ZL · Flat · 3 bed

Was £132,500 (Aug 2018)
Now £270,000 (Jan 2026)
Price change +£137,500 over 7.4 yrs
Total % 103.8%
Annualised % ↑ 10.1%
Listing photo for Aviva College Avenue No. 7

Aviva College Avenue

ME15 6YJ · Detached · 3 bed

Was £445,000 (Oct 2023)
Now £540,000 (Jan 2026)
Price change +£95,000 over 2.3 yrs
Total % 21.3%
Annualised % ↑ 8.8%
Listing photo for 633 Loose Road No. 8

633 Loose Road

ME15 9UT · Terrace · 2 bed

Was £200,000 (Sep 2021)
Now £268,000 (Jun 2025)
Price change +£68,000 over 3.7 yrs
Total % 34.0%
Annualised % ↑ 8.2%
Listing photo for Greenacres East Street No. 9

Greenacres East Street

ME15 0RA · Detached · 4 bed

Was £139,000 (Jan 1998)
Now £1,020,000 (Aug 2025)
Price change +£881,000 over 27.6 yrs
Total % 633.8%
Annualised % ↑ 7.5%
Listing photo for 28 Pickering Street No. 10

28 Pickering Street

ME15 9RS · Detached · 2 bed

Was £220,000 (Oct 2013)
Now £513,000 (Jul 2025)
Price change +£293,000 over 11.7 yrs
Total % 133.2%
Annualised % ↑ 7.5%
Listing photo for 23 Lancashire Road No. 11

23 Lancashire Road

ME15 7QB · Terrace · 3 bed

Was £132,000 (Apr 2013)
Now £320,000 (Apr 2026)
Price change +£188,000 over 12.9 yrs
Total % 142.4%
Annualised % ↑ 7.1%
Listing photo for 26 Waldron Drive No. 12

26 Waldron Drive

ME15 9TH · Semi-D · 3 bed

Was £250,000 (Jul 2011)
Now £660,000 (Jan 2026)
Price change +£410,000 over 14.5 yrs
Total % 164.0%
Annualised % ↑ 6.9%
Listing photo for 27 Bramley Crescent No. 13

27 Bramley Crescent

ME15 8JZ · Semi-D · 2 bed

Was £350,000 (Apr 2023)
Now £405,000 (Jun 2025)
Price change +£55,000 over 2.2 yrs
Total % 15.7%
Annualised % ↑ 6.9%
Listing photo for 51 Sussex Road No. 14

51 Sussex Road

ME15 7HX · Semi-D · 3 bed

Was £160,000 (Mar 2014)
Now £337,500 (Oct 2025)
Price change +£177,500 over 11.6 yrs
Total % 110.9%
Annualised % ↑ 6.7%
Listing photo for 90 Betsham Road No. 15

90 Betsham Road

ME15 8TX · Semi-D · 3 bed

Was £64,000 (Aug 1998)
Now £350,000 (Oct 2025)
Price change +£286,000 over 27.1 yrs
Total % 446.9%
Annualised % ↑ 6.5%

Frequently asked questions

Each entry links sales by the address and property type from Land Registry, with two registered sales at least two years apart. The latest sale was in the last 12 months. Prices are nominal — not adjusted for extensions, condition, or inflation. We show listings with archived photos and floorplans where available (15 snakes, 15 ladders).

A fall is not always a market crash story. Land Registry data input errors, Lease or title changes, part ownership, mis-matched addresses can all influence the numbers. This is not analysis nor is it investment advice, just a bit of fun.

We link sales based on the address and property type provided by Land Registry. We then compare the latest sale to the immediately previous registered sale on that address.

Back to ME15 house price analysis