Property Snakes & Ladders in SK11
The biggest price drops and jumps on homes sold in the last year, compared with their previous Land Registry sale - curiosity, not analysis.
Rankings from Land Registry resales, last calculated 05 June 2026.
Snakes — biggest house price falls in SK11
The top-ranked SK11 properties with the largest house price falls on resale. Go beyond house price indices with specific examples.
 No. 1
No. 1
20 Wardle Crescent
SK11 9RG · Terrace · 3 bed
 No. 2
No. 2
39 Grasmere
SK11 8PL · Detached · 4 bed
 No. 3
No. 3
Apartment 3 Birch House Bridge Street
SK11 6AP · Flat
 No. 4
No. 4
141 Black Road
SK11 7LE · Semi-D · 3 bed
 No. 5
No. 5
4 The Lofts Marlborough Court Pickford Street
SK11 6JD · Flat · 1 bed
 No. 6
No. 6
Flat 8 Stamford Court Stamford Road
SK11 7TQ · Flat · 1 bed
Ladders — largest house price rises in SK11
The top-ranked SK11 properties with the biggest house price rises on resale. Go beyond house price indices with specific examples.
 No. 1
No. 1
29 James Street
SK11 8BP · Terrace · 2 bed
 No. 2
No. 2
Flat J Chapel Court Chapel Street
SK11 8BJ · Flat · 2 bed
 No. 3
No. 3
140 Blakelow Road
SK11 7EF · Detached · 4 bed
 No. 4
No. 4
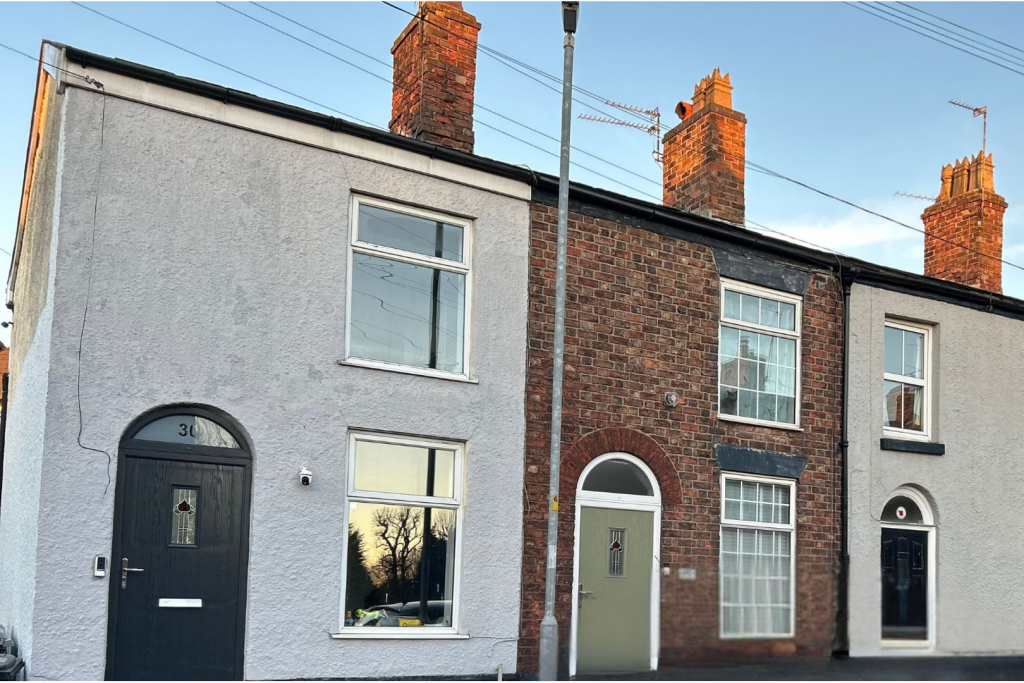
306 Buxton Road
SK11 7EU · Terrace · 2 bed
 No. 5
No. 5
18 Henbury Rise
SK11 9NW · Detached
 No. 6
No. 6
22 Lakeside
SK11 0PL · Terrace · 3 bed
 No. 7
No. 7
98 Pierce Street
SK11 6EX · Terrace · 3 bed
 No. 8
No. 8
198 Bond Street
SK11 6RG · Semi-D · 3 bed
 No. 9
No. 9
8 Penrith Avenue
SK11 8PP · Detached · 4 bed
 No. 10
27 Pioneer Road
SK11 7ZB · Detached
 No. 11
6 Maple Avenue
SK11 7RB · Semi-D · 3 bed
 No. 12
260 Peter Street
SK11 8EX · Terrace · 3 bed
 No. 13
51 Brynmore Drive
SK11 7WA · Semi-D · 3 bed
 No. 14
45 Pioneer Road
SK11 7ZB · Detached
 No. 15
32 Byrons Lane
SK11 7JW · Terrace · 2 bed