Property Snakes & Ladders in KT19 8
The biggest price drops and jumps on homes sold in the last year, compared with their previous Land Registry sale - curiosity, not analysis.
Rankings from Land Registry resales, last calculated 01 July 2026.
Snakes — biggest house price falls in KT19 8
The top-ranked KT19 8 properties with the largest house price falls on resale. Go beyond house price indices with specific examples.
 No. 1
No. 1
23 Gladstone House Horton Crescent
KT19 8BW · Flat · 1 bed
 No. 2
No. 2
24 The Oaks Square
KT19 8AR · Flat · 2 bed
 No. 3
No. 3
2 Granton Court Miller Place
KT19 8GS · Flat
Ladders — largest house price rises in KT19 8
The top-ranked KT19 8 properties with the biggest house price rises on resale. Go beyond house price indices with specific examples.
 No. 1
No. 1
7 Gosfield Road
KT19 8HF · Semi-D · 3 bed
 No. 2
No. 2
33 Lower Hill Road
KT19 8LS · Semi-D · 3 bed
 No. 3
No. 3
55 Hookfield
KT19 8JQ · Semi-D · 3 bed
 No. 4
No. 4
23 Horsley Close
KT19 8HB · Semi-D · 3 bed
 No. 5
No. 5
16 Upper Court Road
KT19 8RD · Semi-D · 2 bed
 No. 6
No. 6
3 Manor Green Road
KT19 8RA · Semi-D · 3 bed
 No. 7
No. 7
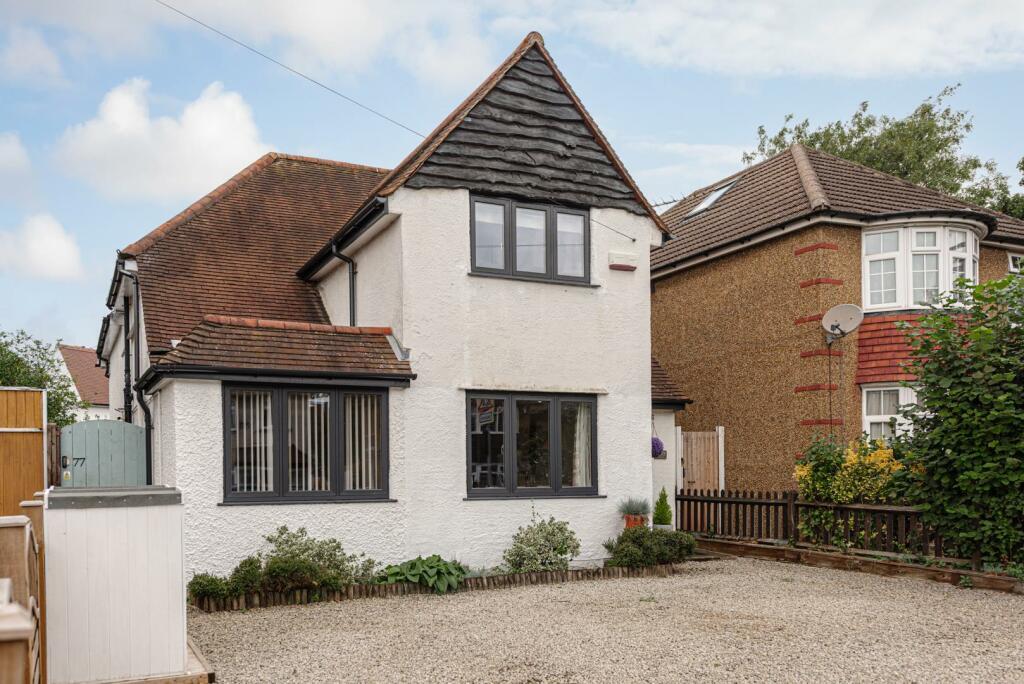
77 Temple Road
KT19 8EY · Semi-D · 3 bed
 No. 8
No. 8
8 Sheraton Drive
KT19 8JL · Terrace · 3 bed
 No. 9
No. 9
9 Eastway
KT19 8SG · Semi-D · 3 bed
 No. 10
63 Manor Green Road
KT19 8RN · Detached · 2 bed
 No. 11
11 Meadway
KT19 8JZ · Detached · 4 bed
 No. 12
133 Hook Road
KT19 8TU · Semi-D · 3 bed
 No. 13
3 Norris Close
KT19 8BF · Terrace · 5 bed
 No. 14
44b Long Grove Road
KT19 8TE · Semi-D · 2 bed
 No. 15
15 Mulberry Close
KT19 8FX · Detached · 4 bed