Property Snakes & Ladders in RM11 3

The biggest price drops and jumps on homes sold in the last year, compared with their previous Land Registry sale - curiosity, not analysis.

Rankings from Land Registry resales, last calculated 05 June 2026.

Explore another area

Snakes — biggest house price falls in RM11 3

The top-ranked RM11 3 properties with the largest house price falls on resale. Go beyond house price indices with specific examples.
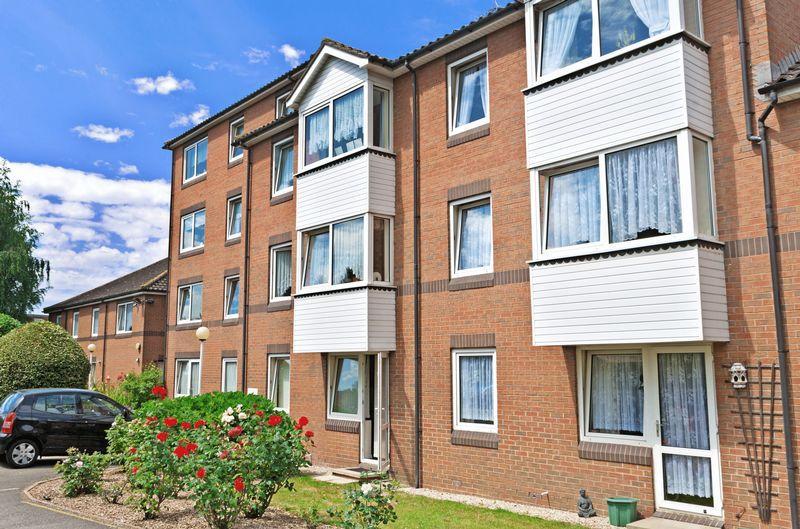
Listing photo for Flat 59 Goldsmere Court Fentiman Way No. 1

Flat 59 Goldsmere Court Fentiman Way

RM11 3XY · Flat · 1 bed

Was £176,000 (Aug 2016)
Now £123,000 (Jan 2026)
Price change -£53,000 over 9.4 yrs
Total % -30.1%
Annualised % ↓ 3.8%
Listing photo for Flat 37 Goldsmere Court Fentiman Way No. 2

Flat 37 Goldsmere Court Fentiman Way

RM11 3XY · Flat · 1 bed

Was £177,600 (Aug 2016)
Now £140,000 (Feb 2026)
Price change -£37,600 over 9.5 yrs
Total % -21.2%
Annualised % ↓ 2.5%
Listing photo for Flat 6 Spire View Court, 35 Upminster Road No. 3

Flat 6 Spire View Court, 35 Upminster Road

RM11 3XA · Flat

Was £390,000 (Jun 2018)
Now £370,000 (Mar 2026)
Price change -£20,000 over 7.7 yrs
Total % -5.1%
Annualised % ↓ 0.7%
Listing photo for Flat 22 Goldsmere Court Fentiman Way No. 4

Flat 22 Goldsmere Court Fentiman Way

RM11 3XY · Flat · 1 bed

Was £149,995 (Apr 2015)
Now £140,000 (Aug 2025)
Price change -£9,995 over 10.4 yrs
Total % -6.7%
Annualised % ↓ 0.7%
Listing photo for 12 Ridgemont Place No. 5

12 Ridgemont Place

RM11 3LQ · Flat · 2 bed

Was £340,000 (Apr 2011)
Now £325,000 (Oct 2025)
Price change -£15,000 over 14.5 yrs
Total % -4.4%
Annualised % ↓ 0.3%

Ladders — largest house price rises in RM11 3

The top-ranked RM11 3 properties with the biggest house price rises on resale. Go beyond house price indices with specific examples.

Listing photo for 52 Link Way No. 1

52 Link Way

RM11 3RW · Terrace · 3 bed

Was £370,000 (Apr 2018)
Now £625,000 (Sep 2025)
Price change +£255,000 over 7.4 yrs
Total % 68.9%
Annualised % ↑ 7.4%
Listing photo for 2 Berkeley Drive No. 2

2 Berkeley Drive

RM11 3PY · Semi-D · 3 bed

Was £241,000 (Nov 2012)
Now £585,000 (Dec 2025)
Price change +£344,000 over 13.0 yrs
Total % 142.7%
Annualised % ↑ 7.0%
Listing photo for 24 Rutland Drive No. 3

24 Rutland Drive

RM11 3EN · Semi-D · 3 bed

Was £80,000 (Nov 1996)
Now £520,000 (Jul 2025)
Price change +£440,000 over 28.6 yrs
Total % 550.0%
Annualised % ↑ 6.8%
Listing photo for 19 Burnway No. 4

19 Burnway

RM11 3SN · Semi-D · 3 bed

Was £129,000 (Jul 1999)
Now £690,000 (Sep 2025)
Price change +£561,000 over 26.1 yrs
Total % 434.9%
Annualised % ↑ 6.6%
Listing photo for 19 Cornwall Close No. 5

19 Cornwall Close

RM11 3HA · Semi-D · 3 bed

Was £148,500 (Dec 2001)
Now £615,000 (Jun 2025)
Price change +£466,500 over 23.5 yrs
Total % 314.1%
Annualised % ↑ 6.2%
Listing photo for 143a Wingletye Lane No. 6

143a Wingletye Lane

RM11 3AR · Detached · 4 bed

Was £525,000 (Jul 2015)
Now £945,000 (Sep 2025)
Price change +£420,000 over 10.2 yrs
Total % 80.0%
Annualised % ↑ 5.9%
Listing photo for 78 Wingletye Lane No. 7

78 Wingletye Lane

RM11 3AU · Semi-D · 3 bed

Was £350,000 (Jan 2015)
Now £635,000 (Aug 2025)
Price change +£285,000 over 10.6 yrs
Total % 81.4%
Annualised % ↑ 5.8%
Listing photo for 21a Wych Elm Road No. 8

21a Wych Elm Road

RM11 3AA · Flat · 2 bed

Was £71,000 (May 1998)
Now £335,000 (Feb 2026)
Price change +£264,000 over 27.8 yrs
Total % 371.8%
Annualised % ↑ 5.7%
Listing photo for 29 Hedingham Road No. 9

29 Hedingham Road

RM11 3QH · Semi-D · 3 bed

Was £327,500 (Feb 2015)
Now £575,000 (Jun 2025)
Price change +£247,500 over 10.4 yrs
Total % 75.6%
Annualised % ↑ 5.6%
Listing photo for 58 Berkeley Drive No. 10

58 Berkeley Drive

RM11 3PZ · Semi-D · 3 bed

Was £250,000 (Jun 2012)
Now £505,000 (Oct 2025)
Price change +£255,000 over 13.3 yrs
Total % 102.0%
Annualised % ↑ 5.4%
Listing photo for 21 Rutland Drive No. 11

21 Rutland Drive

RM11 3EW · Terrace · 5 bed

Was £250,000 (Oct 2012)
Now £480,000 (Sep 2025)
Price change +£230,000 over 12.9 yrs
Total % 92.0%
Annualised % ↑ 5.2%
Listing photo for 210 Wingletye Lane No. 12

210 Wingletye Lane

RM11 3AL · Detached · 5 bed

Was £465,000 (Apr 2012)
Now £900,000 (Jun 2025)
Price change +£435,000 over 13.2 yrs
Total % 93.5%
Annualised % ↑ 5.1%
Listing photo for 8 St Georges Avenue No. 13

8 St Georges Avenue

RM11 3PD · Detached · 4 bed

Was £220,000 (Oct 1999)
Now £810,000 (Oct 2025)
Price change +£590,000 over 26.0 yrs
Total % 268.2%
Annualised % ↑ 5.1%
Listing photo for 197 Wingletye Lane No. 14

197 Wingletye Lane

RM11 3AL · Detached · 3 bed

Was £650,000 (Oct 2014)
Now £1,100,000 (Oct 2025)
Price change +£450,000 over 11.0 yrs
Total % 69.2%
Annualised % ↑ 4.9%
Listing photo for 17 Allenby Drive No. 15

17 Allenby Drive

RM11 3SA · Detached · 5 bed

Was £425,000 (Feb 2017)
Now £635,000 (Jun 2025)
Price change +£210,000 over 8.4 yrs
Total % 49.4%
Annualised % ↑ 4.9%

Frequently asked questions

Each entry links sales by the address and property type from Land Registry, with two registered sales at least two years apart. The latest sale was in the last 12 months. Prices are nominal — not adjusted for extensions, condition, or inflation. We show listings with archived photos and floorplans where available (15 snakes, 15 ladders).

A fall is not always a market crash story. Land Registry data input errors, Lease or title changes, part ownership, mis-matched addresses can all influence the numbers. This is not analysis nor is it investment advice, just a bit of fun.

We link sales based on the address and property type provided by Land Registry. We then compare the latest sale to the immediately previous registered sale on that address.

Back to RM11 3 house price analysis