Property Snakes & Ladders in M20 6

The biggest price drops and jumps on homes sold in the last year, compared with their previous Land Registry sale - curiosity, not analysis.

Rankings from Land Registry resales, last calculated 05 June 2026.

Explore another area

Snakes — biggest house price falls in M20 6

The top-ranked M20 6 properties with the largest house price falls on resale. Go beyond house price indices with specific examples.

Listing photo for Flat 17 Elmwood Lodge, 17 Parkfield Road South No. 1

Flat 17 Elmwood Lodge, 17 Parkfield Road South

M20 6DB · Flat · 3 bed

Was £380,000 (Sep 2022)
Now £370,000 (Aug 2025)
Price change -£10,000 over 2.9 yrs
Total % -2.6%
Annualised % ↓ 0.9%

Ladders — largest house price rises in M20 6

The top-ranked M20 6 properties with the biggest house price rises on resale. Go beyond house price indices with specific examples.
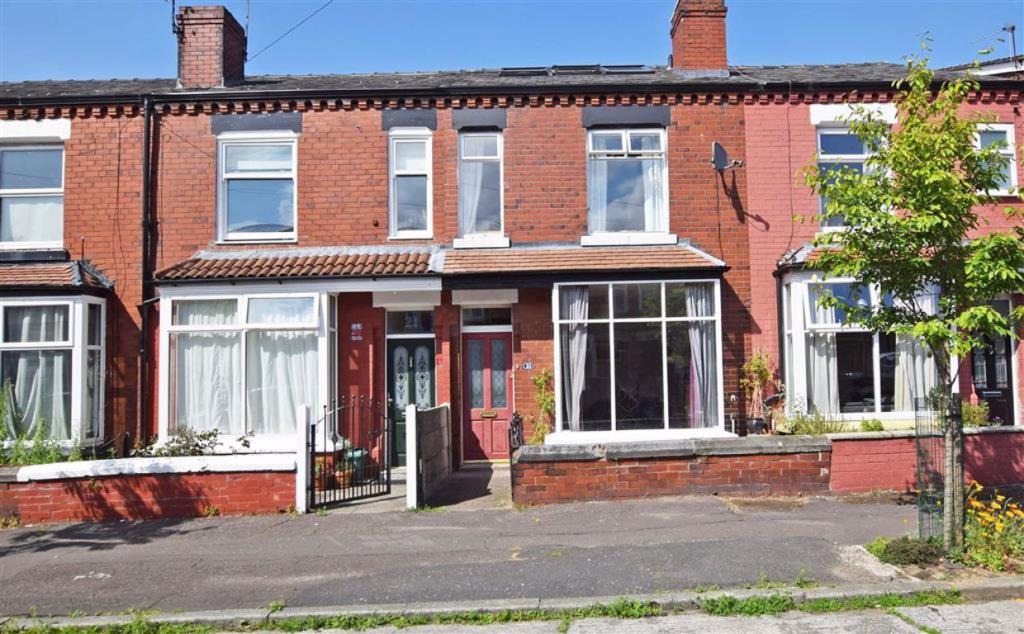
Listing photo for 7 Norwood Avenue No. 1

7 Norwood Avenue

M20 6EX · Terrace · 3 bed

Was £220,000 (Oct 2020)
Now £404,000 (Mar 2026)
Price change +£184,000 over 5.3 yrs
Total % 83.6%
Annualised % ↑ 12.1%
Listing photo for 4 Lidgate Grove No. 2

4 Lidgate Grove

M20 6TS · Terrace · 2 bed

Was £305,050 (Nov 2018)
Now £580,000 (Sep 2025)
Price change +£274,950 over 6.8 yrs
Total % 90.1%
Annualised % ↑ 10.0%
Listing photo for 141 Fog Lane No. 3

141 Fog Lane

M20 6ED · Semi-D · 3 bed

Was £445,500 (Jun 2021)
Now £650,000 (Jul 2025)
Price change +£204,500 over 4.0 yrs
Total % 45.9%
Annualised % ↑ 9.8%
Listing photo for 17a Brayside Road No. 4

17a Brayside Road

M20 6FG · Detached · 3 bed

Was £152,550 (Aug 2013)
Now £400,000 (Jul 2025)
Price change +£247,450 over 12.0 yrs
Total % 162.2%
Annualised % ↑ 8.4%
Listing photo for 23 Leyland Avenue No. 5

23 Leyland Avenue

M20 6EW · Terrace · 4 bed

Was £250,000 (Mar 2021)
Now £341,750 (Jun 2025)
Price change +£91,750 over 4.3 yrs
Total % 36.7%
Annualised % ↑ 7.6%
Listing photo for 141 Atwood Road No. 6

141 Atwood Road

M20 6JW · Semi-D · 4 bed

Was £470,000 (Aug 2017)
Now £840,000 (Jul 2025)
Price change +£370,000 over 8.0 yrs
Total % 78.7%
Annualised % ↑ 7.6%
Listing photo for 32 Austin Drive No. 7

32 Austin Drive

M20 6EG · Semi-D · 3 bed

Was £390,000 (Oct 2020)
Now £565,000 (Jan 2026)
Price change +£175,000 over 5.3 yrs
Total % 44.9%
Annualised % ↑ 7.2%
Listing photo for 27a Elm Road No. 8

27a Elm Road

M20 6XD · Detached · 4 bed

Was £870,000 (Sep 2018)
Now £1,385,000 (Aug 2025)
Price change +£515,000 over 6.8 yrs
Total % 59.2%
Annualised % ↑ 7.0%
Listing photo for 13 Westcroft Road No. 9

13 Westcroft Road

M20 6FE · Semi-D · 3 bed

Was £317,500 (Aug 2023)
Now £372,000 (Dec 2025)
Price change +£54,500 over 2.3 yrs
Total % 17.2%
Annualised % ↑ 7.0%
Listing photo for 5 Willow Way No. 10

5 Willow Way

M20 6JT · Semi-D · 3 bed

Was £360,000 (Dec 2013)
Now £780,000 (Sep 2025)
Price change +£420,000 over 11.8 yrs
Total % 116.7%
Annualised % ↑ 6.8%
Listing photo for 31 Old Oak Street No. 11

31 Old Oak Street

M20 6RH · Terrace · 2 bed

Was £240,000 (Apr 2020)
Now £348,000 (Jan 2026)
Price change +£108,000 over 5.8 yrs
Total % 45.0%
Annualised % ↑ 6.7%
Listing photo for 3 Ladysmith Road No. 12

3 Ladysmith Road

M20 6HP · Semi-D · 3 bed

Was £128,000 (Jul 2002)
Now £572,500 (Nov 2025)
Price change +£444,500 over 23.3 yrs
Total % 347.3%
Annualised % ↑ 6.6%
Listing photo for 23 Norwood Avenue No. 13

23 Norwood Avenue

M20 6EX · Terrace · 3 bed

Was £300,000 (Oct 2019)
Now £430,000 (Jul 2025)
Price change +£130,000 over 5.7 yrs
Total % 43.3%
Annualised % ↑ 6.5%
Listing photo for 29 Beaver Road No. 14

29 Beaver Road

M20 6SX · Semi-D

Was £340,000 (Nov 2015)
Now £625,000 (Oct 2025)
Price change +£285,000 over 9.9 yrs
Total % 83.8%
Annualised % ↑ 6.4%
Listing photo for 35 School Lane No. 15

35 School Lane

M20 6SA · Semi-D · 2 bed

Was £267,500 (Feb 2019)
Now £400,000 (Sep 2025)
Price change +£132,500 over 6.6 yrs
Total % 49.5%
Annualised % ↑ 6.3%

Frequently asked questions

Each entry links sales by the address and property type from Land Registry, with two registered sales at least two years apart. The latest sale was in the last 12 months. Prices are nominal — not adjusted for extensions, condition, or inflation. We show listings with archived photos and floorplans where available (15 snakes, 15 ladders).

A fall is not always a market crash story. Land Registry data input errors, Lease or title changes, part ownership, mis-matched addresses can all influence the numbers. This is not analysis nor is it investment advice, just a bit of fun.

We link sales based on the address and property type provided by Land Registry. We then compare the latest sale to the immediately previous registered sale on that address.

Back to M20 6 house price analysis